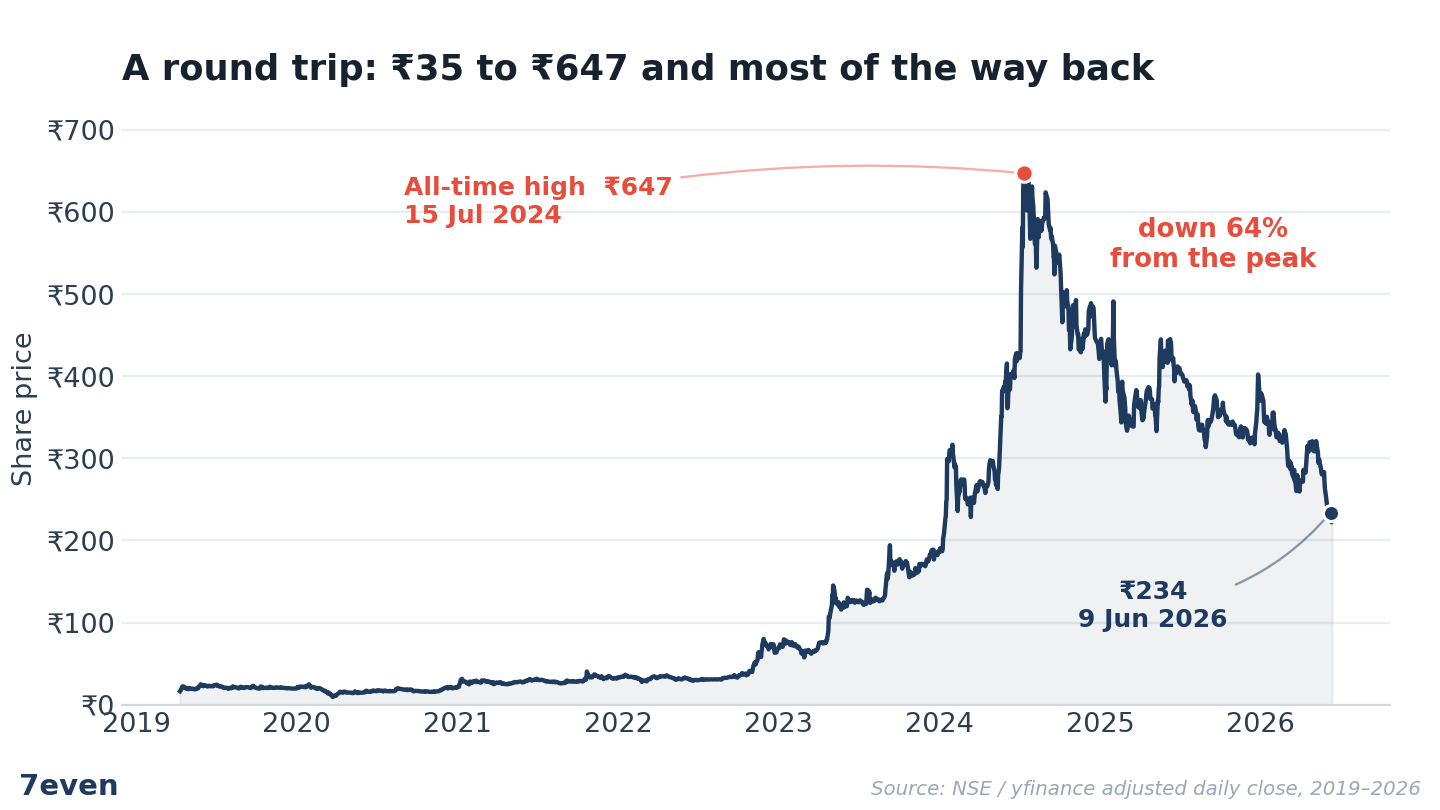
Rail Vikas Nigam (RVNL) is down about 46% over the past year and roughly 64% from the ₹647 high it hit in July 2024. On 9 June 2026, it closed at ₹234.
The natural reaction to a chart like that is to go looking for a bargain. A railway PSU, nearly two-thirds of its top, sitting on a ₹99,000 crore order book. Surely the pain is in the price by now.
We don’t think it is. At ₹234, RVNL still trades at about 56 times trailing earnings. For a company that builds railway lines for a living, and whose profits are shrinking, that is not a beaten-down valuation. It’s a growth valuation.
So here’s the question the chart hides. If the stock has fallen this hard, why is it still this expensive?
The answer isn’t in the price chart. It’s in the financial statements, which is the one place a falling chart trains people not to look. Open the books and the “bargain” falls apart in three steps: the multiple never actually came down, the profit behind it is shrinking, and a big chunk of that profit was never really about railways. Take them one at a time.
The rally was never about profit
Walk back to where this started. Between FY21 and FY24, RVNL grew net profit from ₹992 crore to ₹1,551 crore. That’s about 56% over three years. Decent for an infrastructure contractor. Nothing that should move a stock more than eighteen-fold.
But that is exactly what the stock did. It ran from around ₹35 at the FY21 close to ₹647 at the July 2024 peak.
When a price climbs far faster than the earnings under it, that’s a re-rating. Investors simply decide to pay more for each rupee of profit. RVNL’s trailing P/E went from roughly 7 times in FY22 to north of 80 times at the July 2024 peak. The “government capex supercycle” story did the lifting. The income statement was along for the ride.
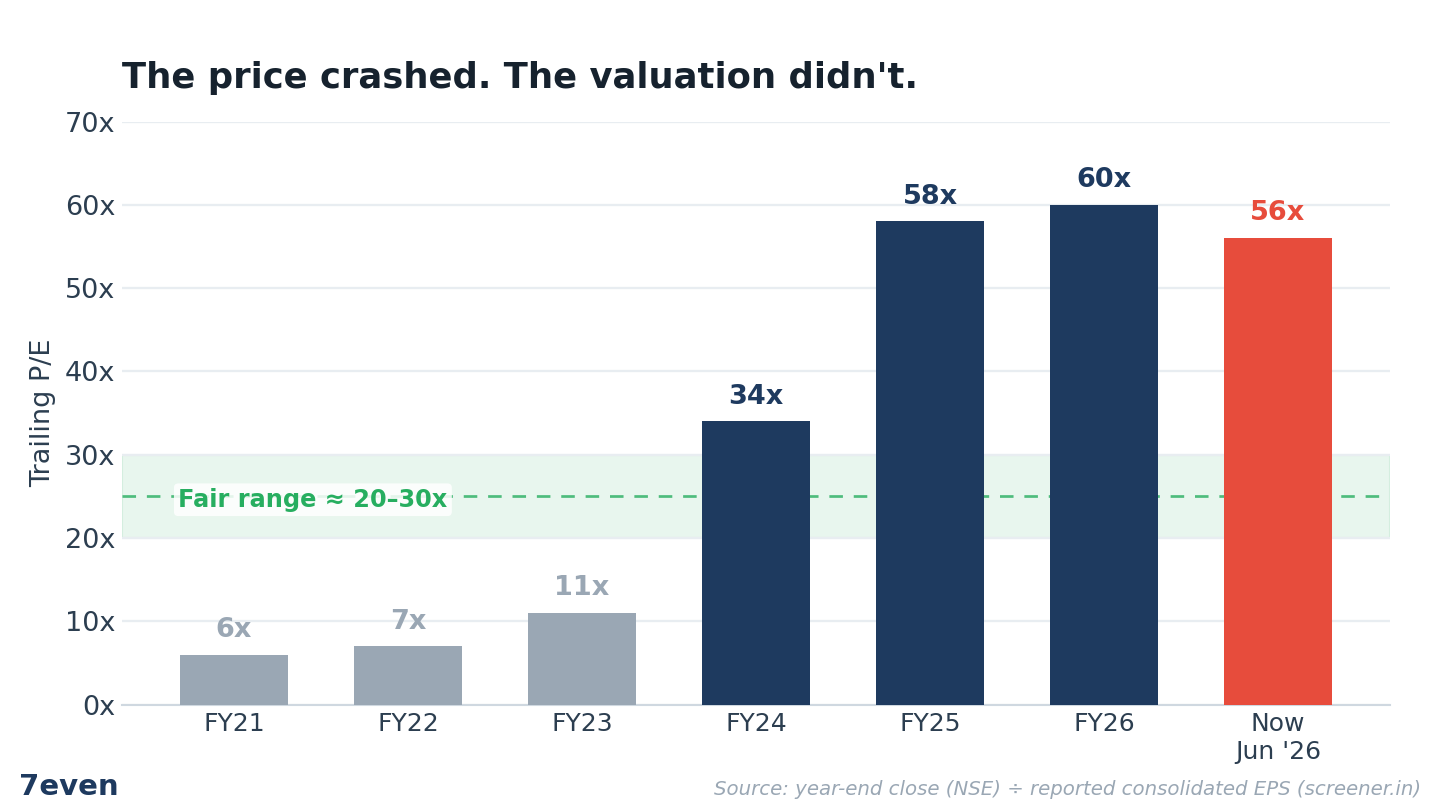
Now look at what happened on the way down, because this is the part most people miss. The price collapsed. The multiple didn’t follow it down. At the end of FY24, the stock traded around 34 times earnings. Today, after a 64% crash, it trades at 56 times. It is more expensive now than it was at the close of FY24, because earnings fell even faster than the price did.
That’s the trick this stock is playing. Everyone assumes a 64% drop means the valuation has reset. It hasn’t. The de-rating happened to the share price. The valuation is still sitting up where the mania left it, and nowhere near the 7 to 11 times it traded at before the story began.
Earnings are moving the wrong way
A rich multiple can be fine if profits are still climbing. RVNL’s are doing the opposite.
Profit peaked in FY24 at ₹1,551 crore. It fell 17% the next year to ₹1,282 crore, then another 32% in FY26 to ₹871 crore. Two down years in a row. The profit base is now 44% below where it was at the peak.
Revenue tells the slower half of the story. It has gone almost nowhere for three years: ₹21,879 crore in FY24, ₹19,923 crore in FY25, ₹20,412 crore in FY26. The top line flatlined while the bottom line shrank. That combination points at margins, not just growth.
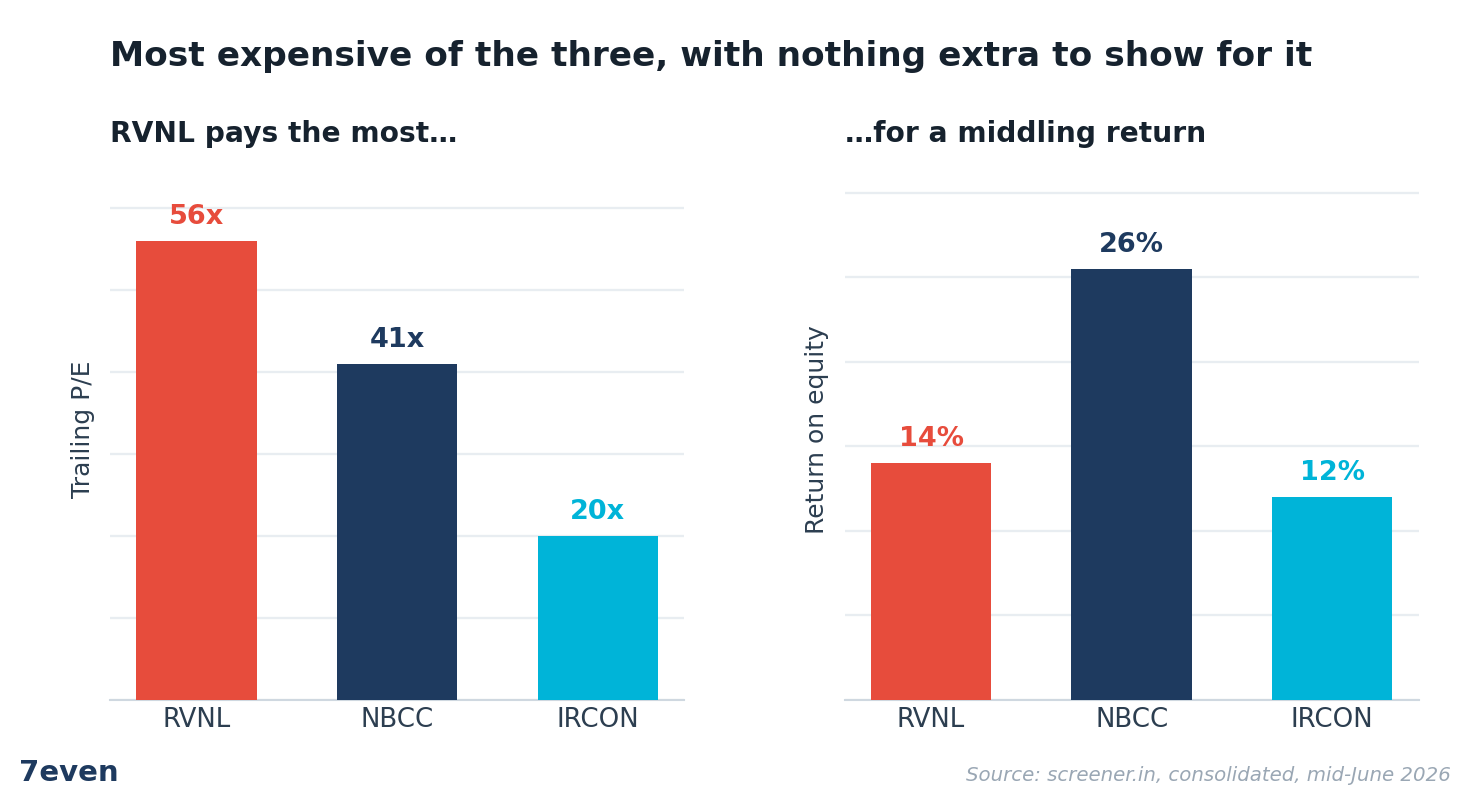
The latest quarter makes it sharper. In Q4 FY26, revenue actually rose 4.2% year on year to ₹6,696 crore. Net profit still fell 60%, from ₹459 crore to ₹182 crore. The operating margin dropped to under 6%. More work for less money. That is the reverse of operating leverage, and it is not the kind of business a 56x multiple is supposed to be describing.
Half the profit isn’t railways
Pull the income statement apart, and you find something that’s easy to miss. In FY25, RVNL’s other income of ₹1,095 crore was almost as big as its entire operating profit of ₹1,125 crore. This “other income” is mostly interest the company earns on its large pile of cash and receivables. For years, it has run at roughly two-thirds of pre-tax profit.
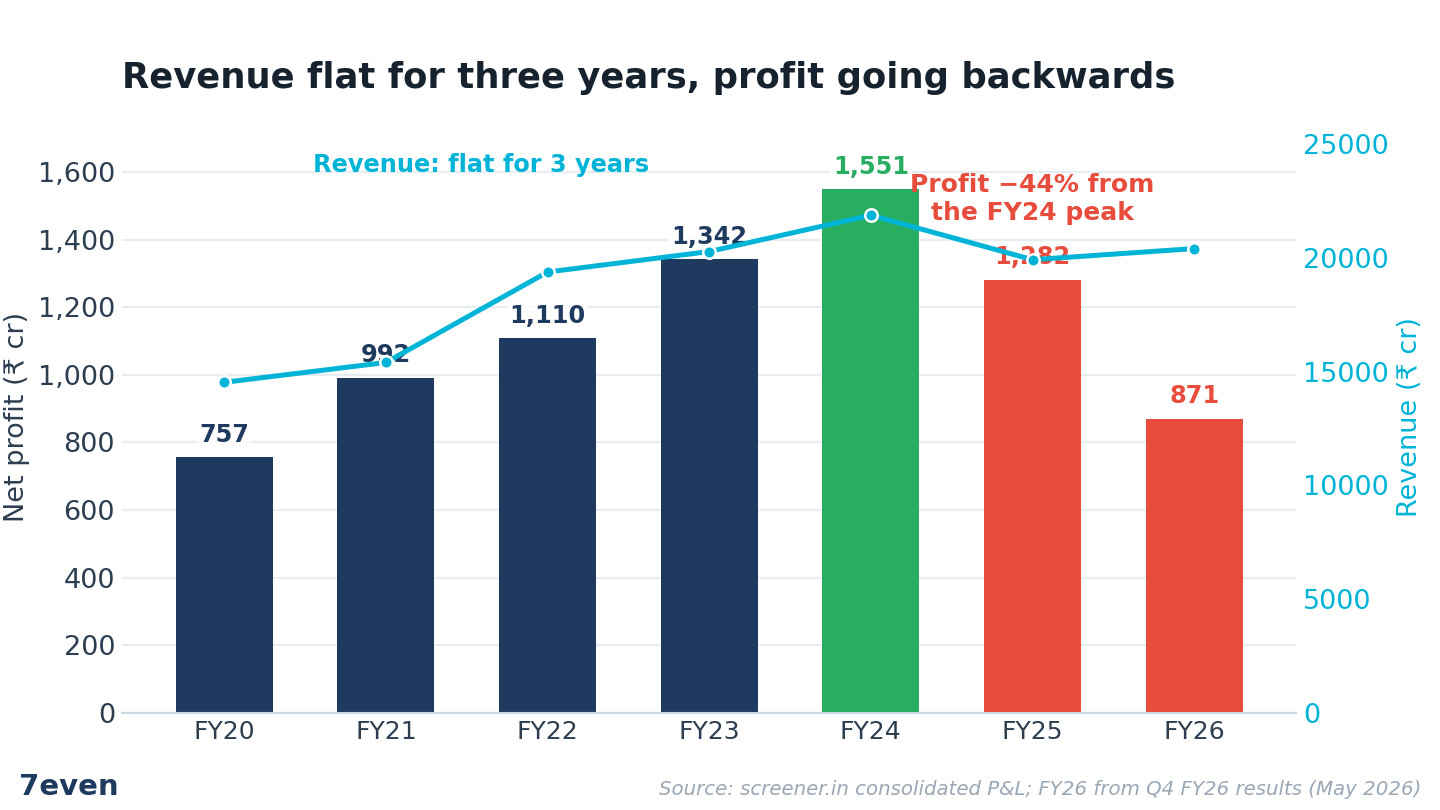
None of this is dodgy, and it isn't unusual for an asset-heavy government executor that sits on a lot of float. But it changes how you should read the headline number. The core business, the part that actually builds rail projects, runs at a 5 to 6% operating margin. A big slice of what lands in "profit" is financial income, and a contractor's earnings multiple has no business capitalising that at 56 times.
The peer test doesn’t help RVNL either
The cleanest way to judge a multiple is against the companies most like it. For RVNL, that’s the other listed PSU construction names, NBCC and IRCON.
NBCC trades at about 41 times earnings. That’s not cheap, but it comes with a 25.5% return on equity, an effectively debt-free balance sheet, and profit that compounded at 51% a year over five years. IRCON trades at about 20 times, on a return on equity near 12%. RVNL sits at 56 times, on a return on equity of about 14%, which is falling (it was 17 to 18% a few years ago), with a profit line in decline.
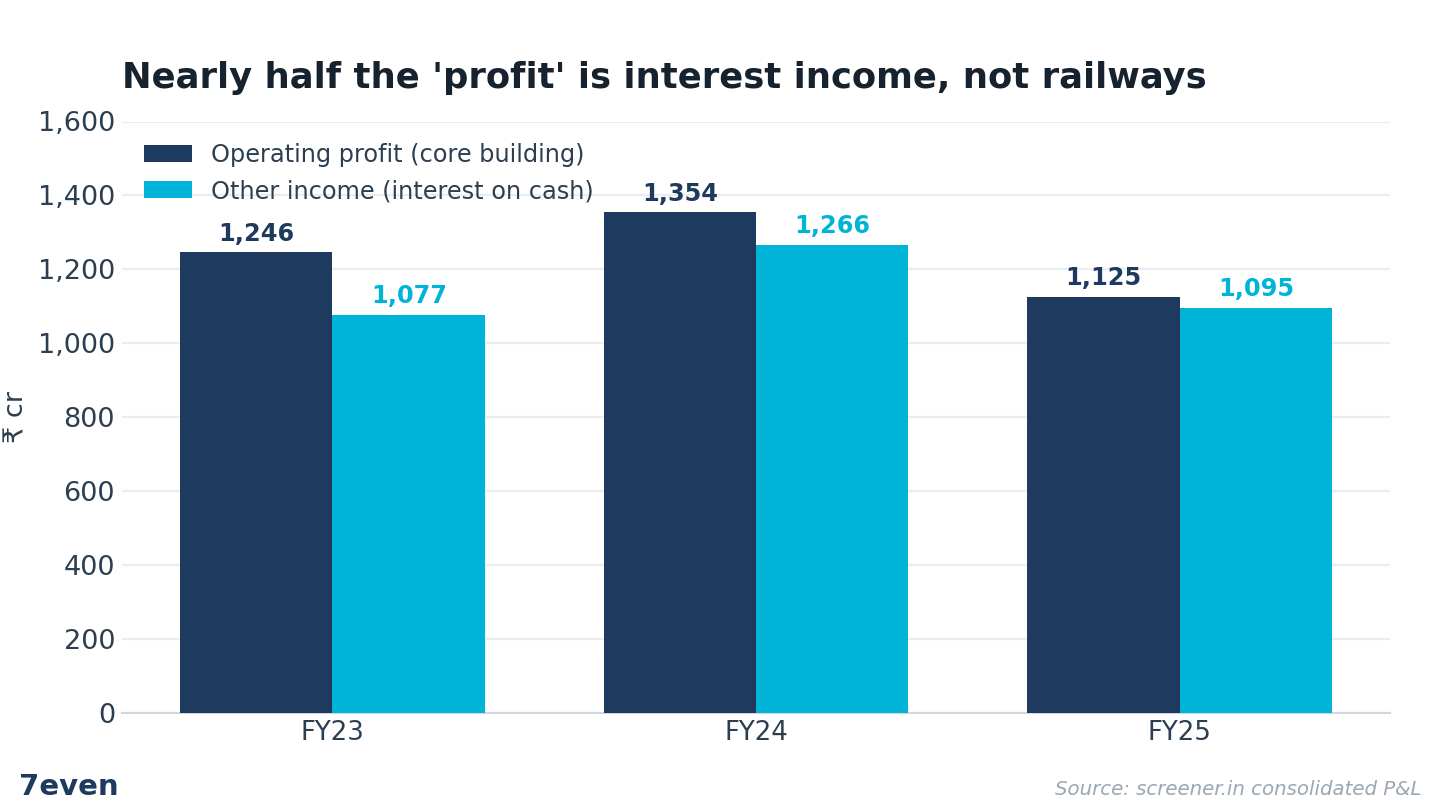
So, RVNL carries the highest multiple of the three by a wide margin and gets the least for it. NBCC’s premium at least buys genuinely better economics: a far higher return, no debt, real profit growth. RVNL’s premium buys a 14% return that sits in the middle of the pack, not above it, on a business whose profit is shrinking.
There’s one more detail the bulls tend to skip. The promoter, which is the government itself, was a seller into the rally. Promoter holding dropped from 87.8% in FY20 to 72.84% by FY24, sold down through a series of offers for sale. When the insider with the clearest view of the order pipeline is trimming, it’s worth asking who was on the other side. Mostly retail. The shareholder count went from under two lakh in FY20 to more than 22 lakh.
Oversold and expensive aren’t the same thing
The best argument for buying here is a technical one. The stock is down nearly two-thirds, sentiment is washed out, and beaten-down PSUs have a habit of snapping back hard.
That’s real, and it can absolutely produce a bounce in price. But “oversold” is a statement about price momentum. “Expensive” is a statement about what you pay for a rupee of earnings. A stock can be both at the same time, and RVNL is. The bounce and the valuation are two different questions, and the quickest way to lose money is to answer the second one with the first.
Where this view could be wrong
We hold this loosely because there are honest ways the thesis breaks.
The order book is genuinely huge. At ₹99,262 crore as of 31 March 2026, it’s close to five years of revenue. If execution speeds up and margins recover toward even 7 to 8%, FY27 earnings could jump. And because the P/E is a fraction with earnings on the bottom, a sharp rebound in profit would shrink the multiple fast without the price doing anything at all. Management is guiding to 15 to 20% revenue growth in FY27, with better margins. If they deliver, today’s 56x becomes tomorrow’s 30x.
That’s why the thing to watch isn’t order wins. RVNL announces those almost weekly. It’s the conversion rate, how quickly the order book turns into billed revenue, and whether margins recover while it does. That shows up in the quarterly operating margin and the revenue run-rate, not in the press releases.
Corporate action is a wildcard too. In March 2026, there were reports of a possible IRCON and RVNL merger. IRCON denied it. But railway-PSU consolidation is exactly the kind of event that can re-rate a stock overnight, regardless of fundamentals.
And the other income is partly structural. RVNL really does earn on the funds it deploys, so anyone who waves it away entirely is overstating the bear case.
Even after granting all of that, the maths still asks a lot. A fair multiple for an EPC business, anchored to where IRCON and NBCC trade and to RVNL’s own pre-mania history, sits closer to 25 to 30 times (that’s our judgement, not a sourced figure). Get there even on a recovered FY27 earnings base, and the implied price is still below today’s. For the current price to make sense, the order book has to do more than deliver. It has to deliver and re-accelerate margins just to stand still. A new buyer needs even more than that.
That’s the asymmetry we keep coming back to. The price fell 64%. The expectations baked into it barely moved. And none of that needed a forecast to see. It was sitting in the financial statements the whole time, while everyone watched the chart.
7even publishes research, not recommendations. Nothing here is investment advice. Always do your own work, and consult a SEBI-registered advisor before acting on anything you read.
Sources: Share price and all-time high, NSE daily data via yfinance adjusted close (2019 to 2026); ₹647 record high on 15 July 2024 also per BusinessToday. Financials, P/E, ROE, shareholding and other income, screener.in: RVNL, NBCC, IRCON. Q4 and FY26 results, Free Press Journal and ScanX. Order book and FY27 guidance, RVNL Q4 FY26 results and ScanX. IRCON and RVNL merger denial, BSE filing, March 2026.
Note on the P/E figures. The 56x headline is ₹234 divided by RVNL’s FY26 consolidated EPS of about ₹4.18 (₹870.7 crore of profit on 208.5 crore shares). Year-end P/E figures in the chart use each year’s closing price over reported consolidated EPS. Third-party sites quote anywhere from about 51x to 60x, depending on whether they use standalone or consolidated EPS and which trailing window they pick. Peer multiples are as of mid-June 2026 and move with price.