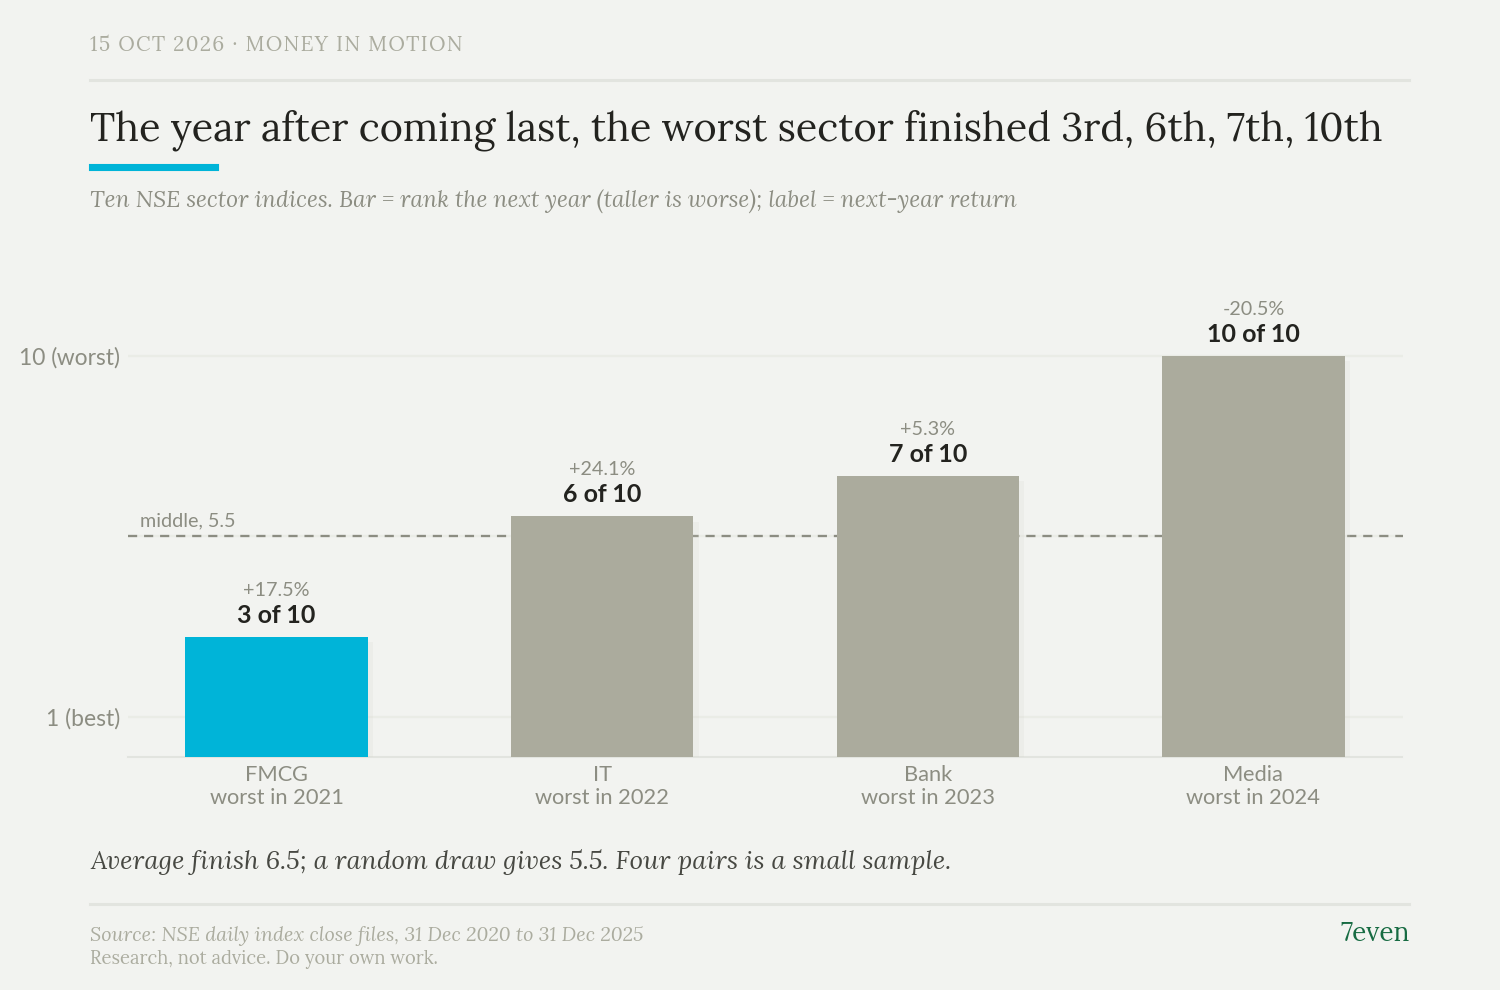
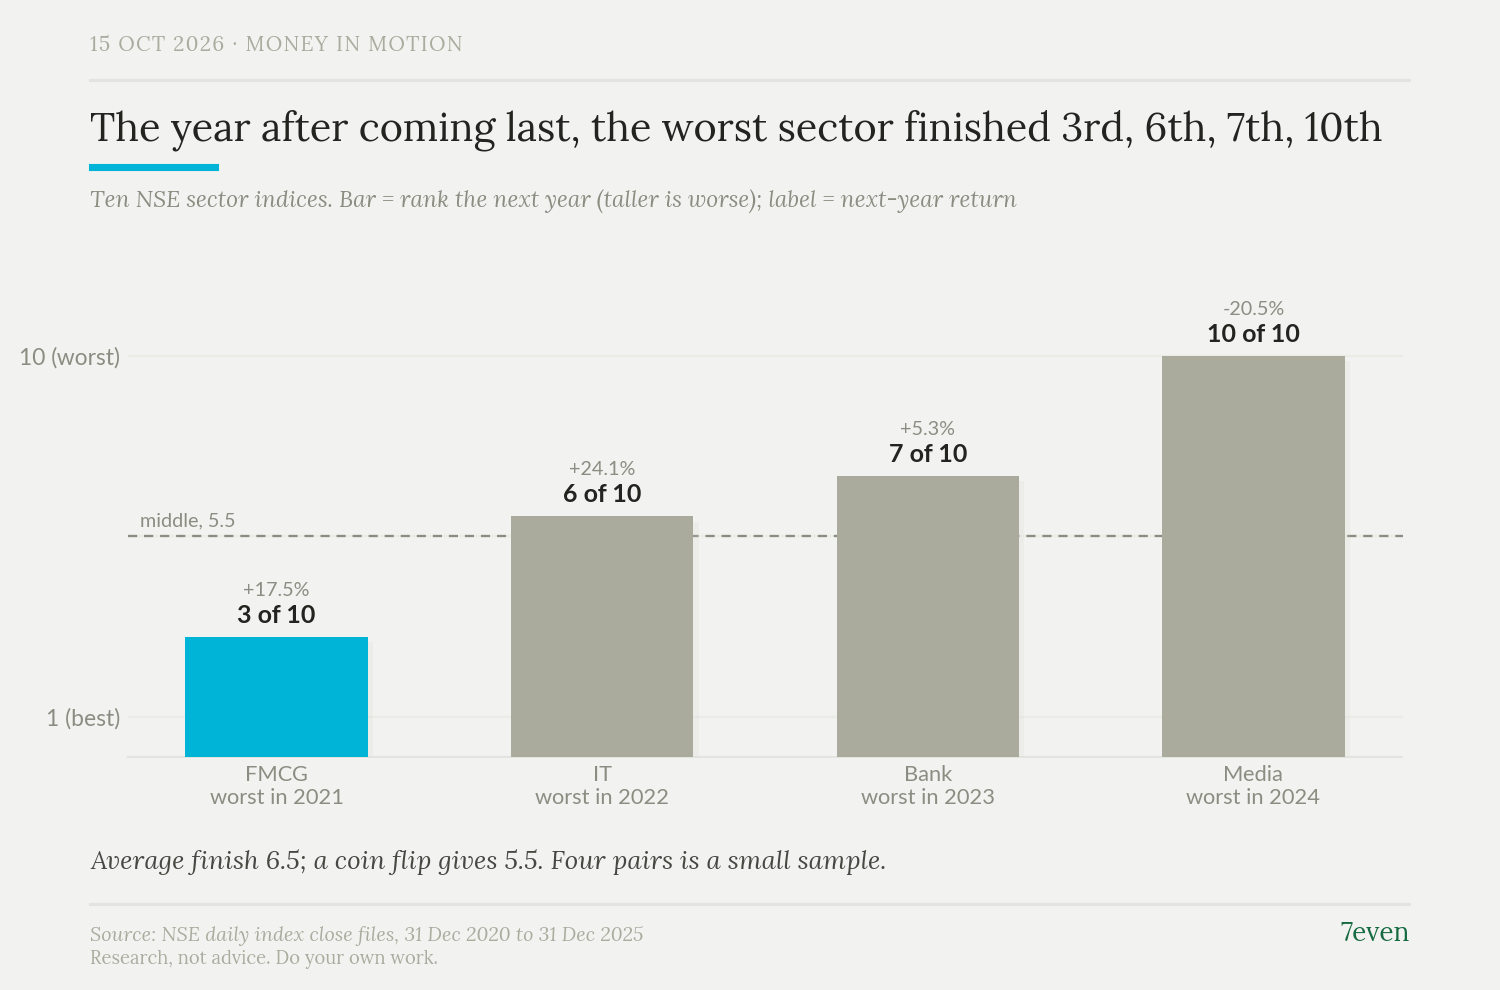
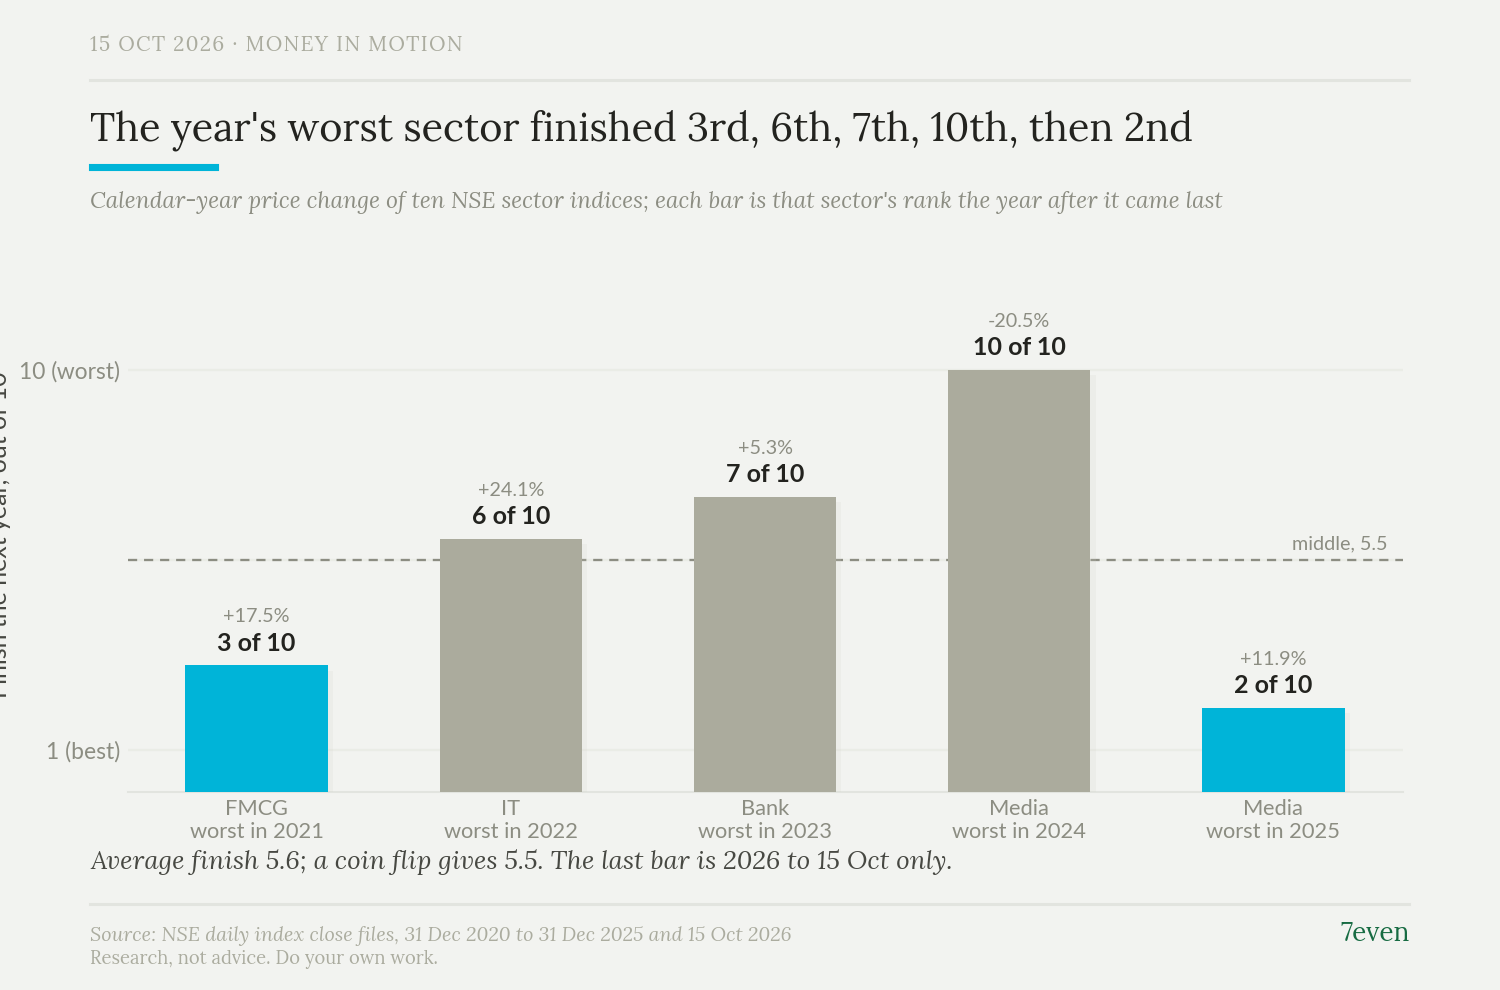
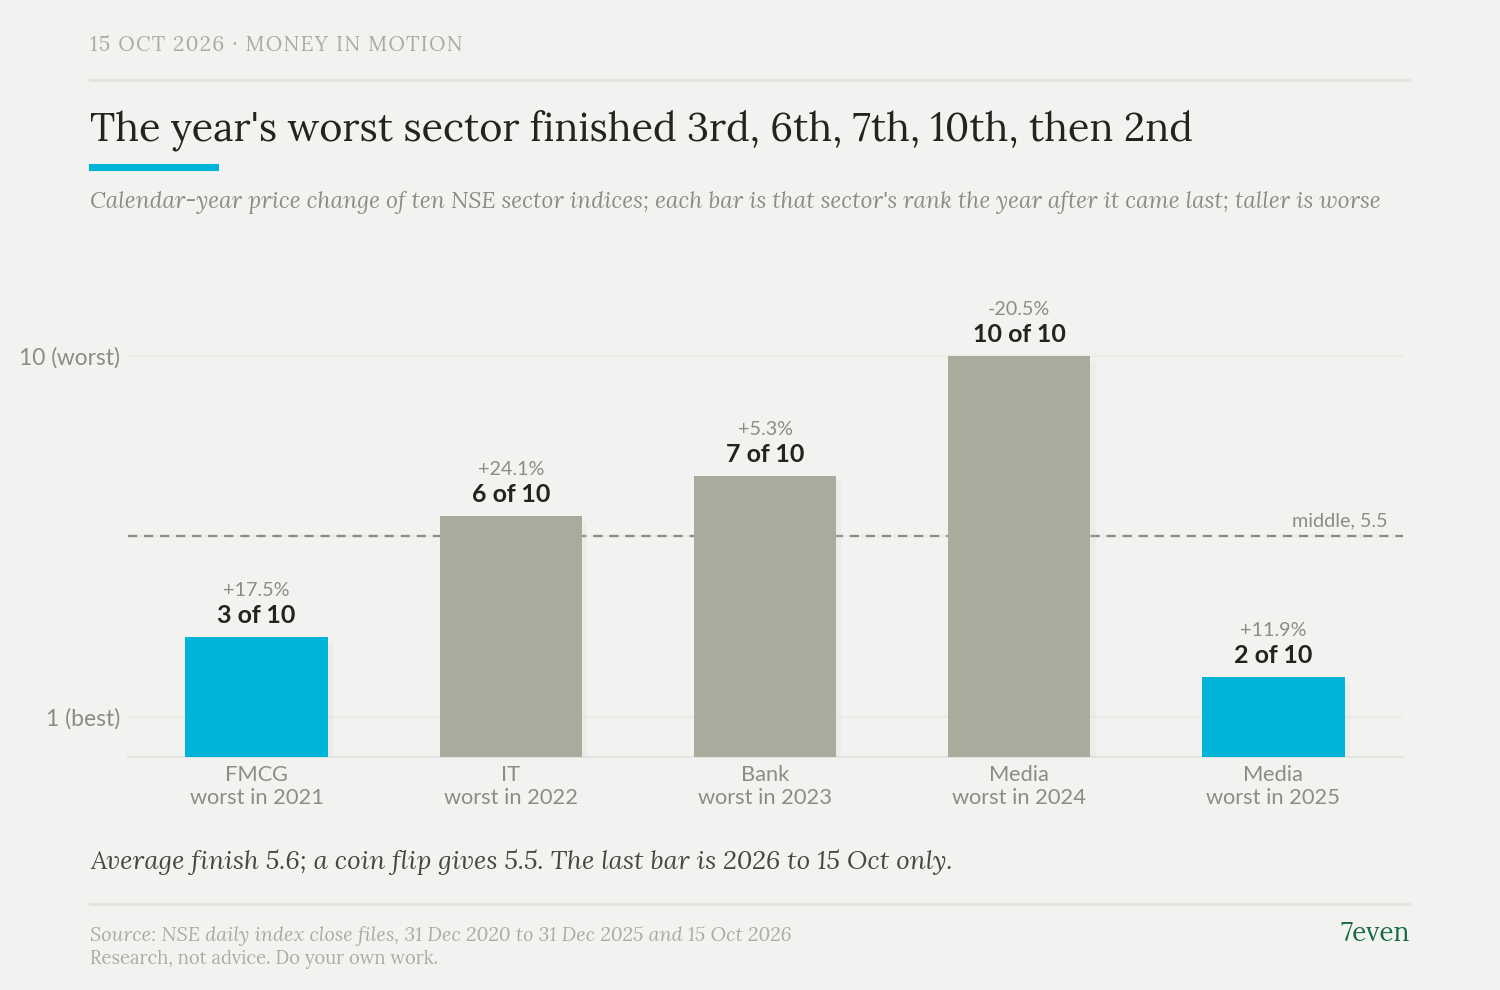
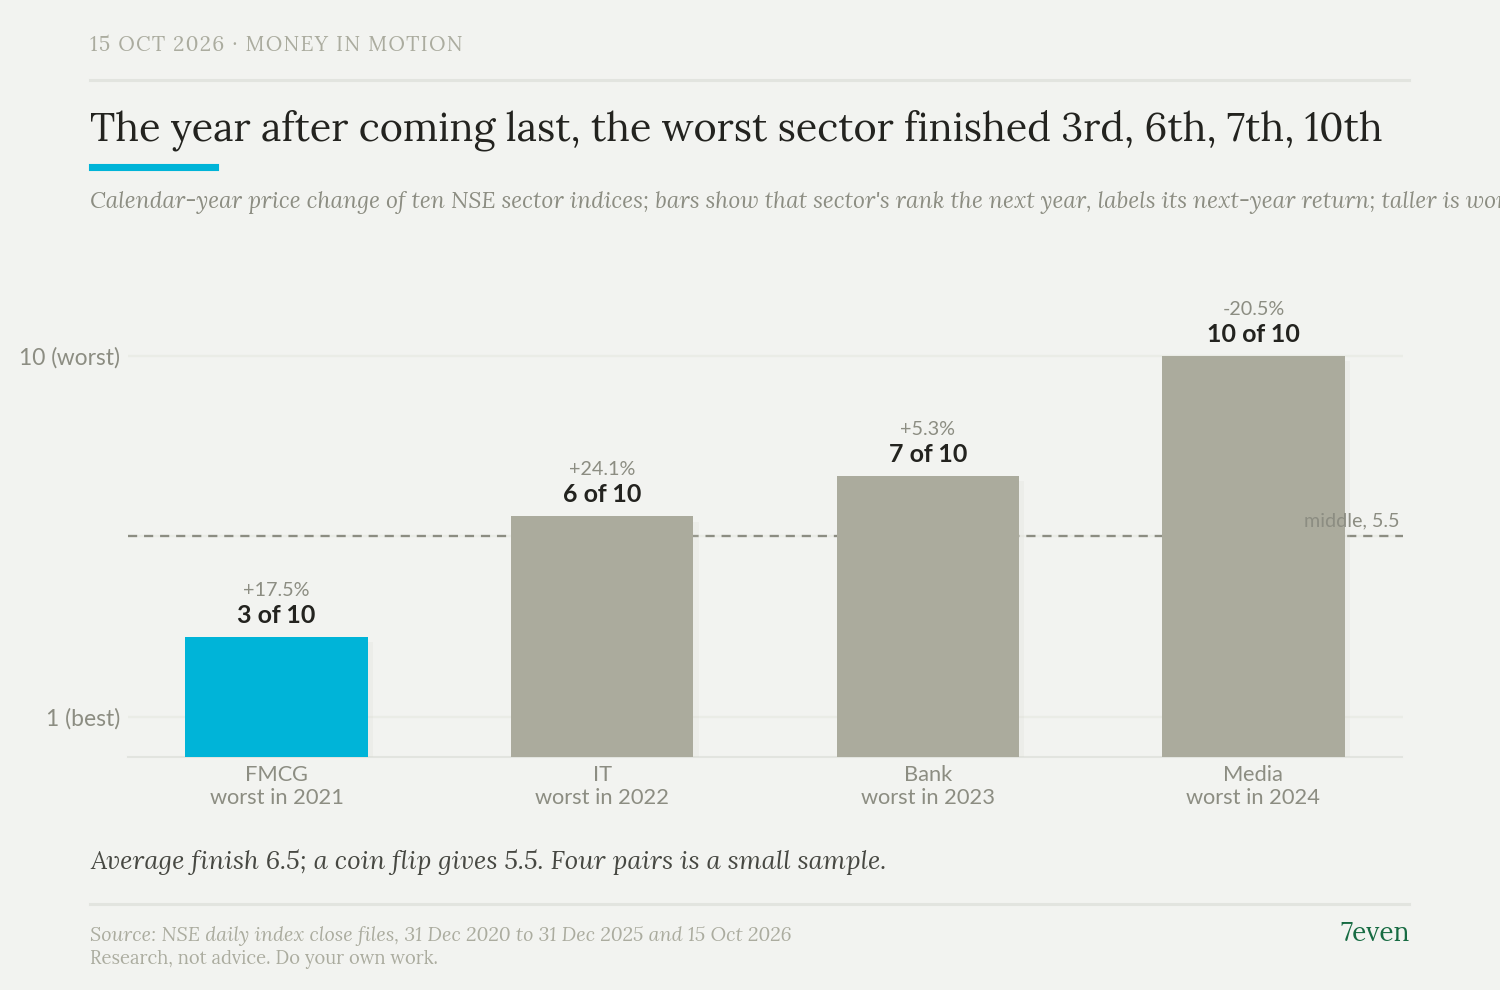
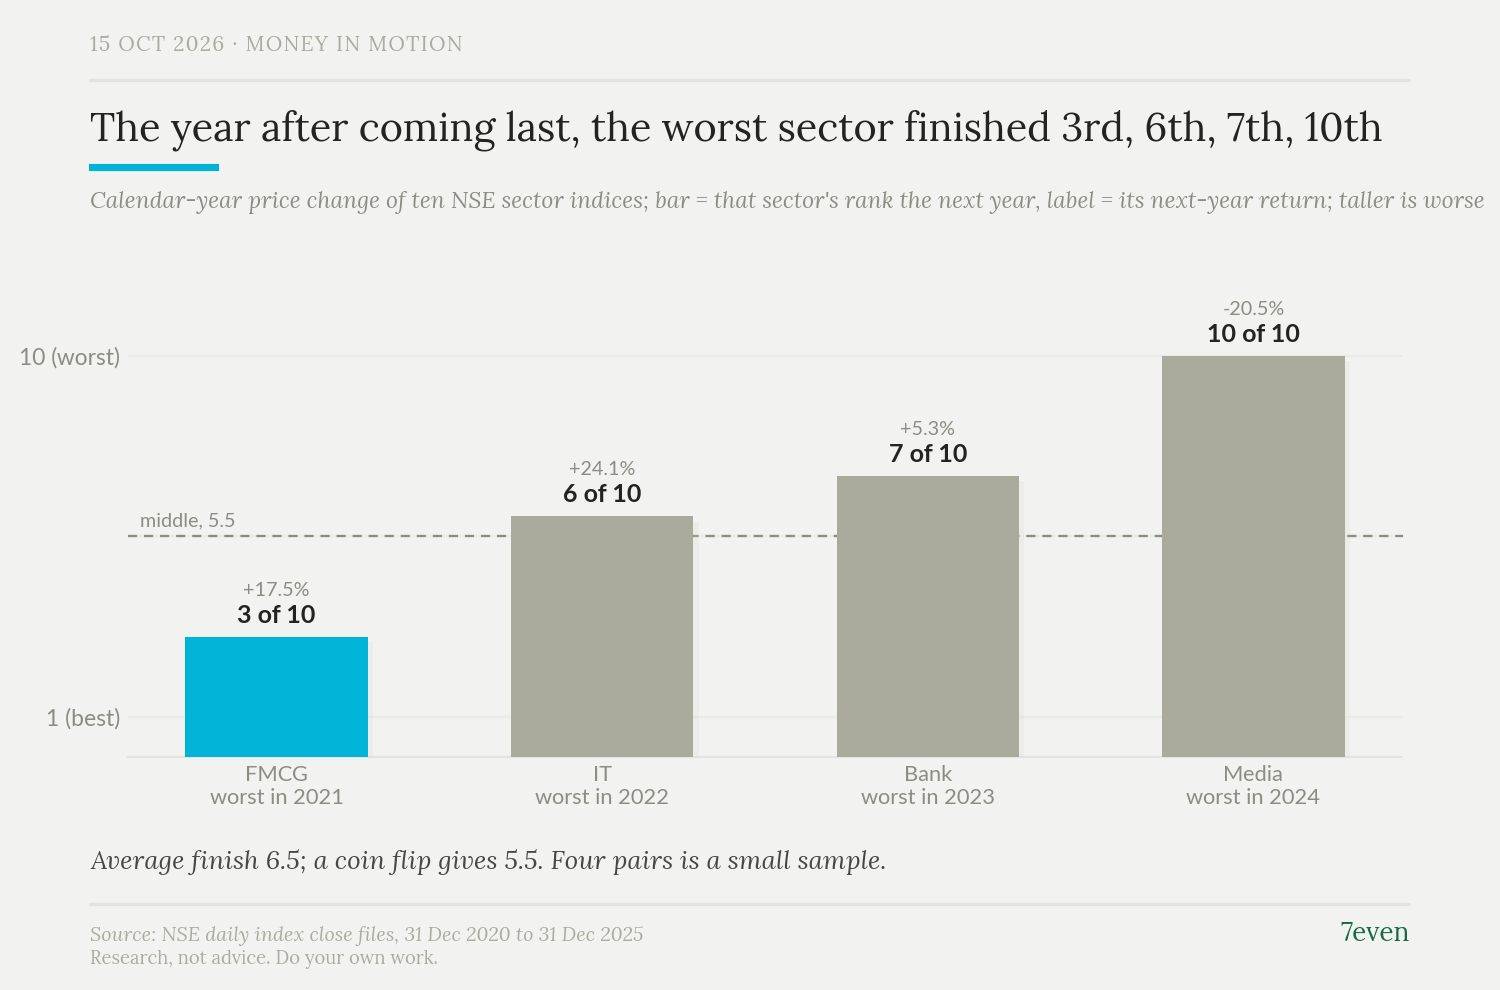
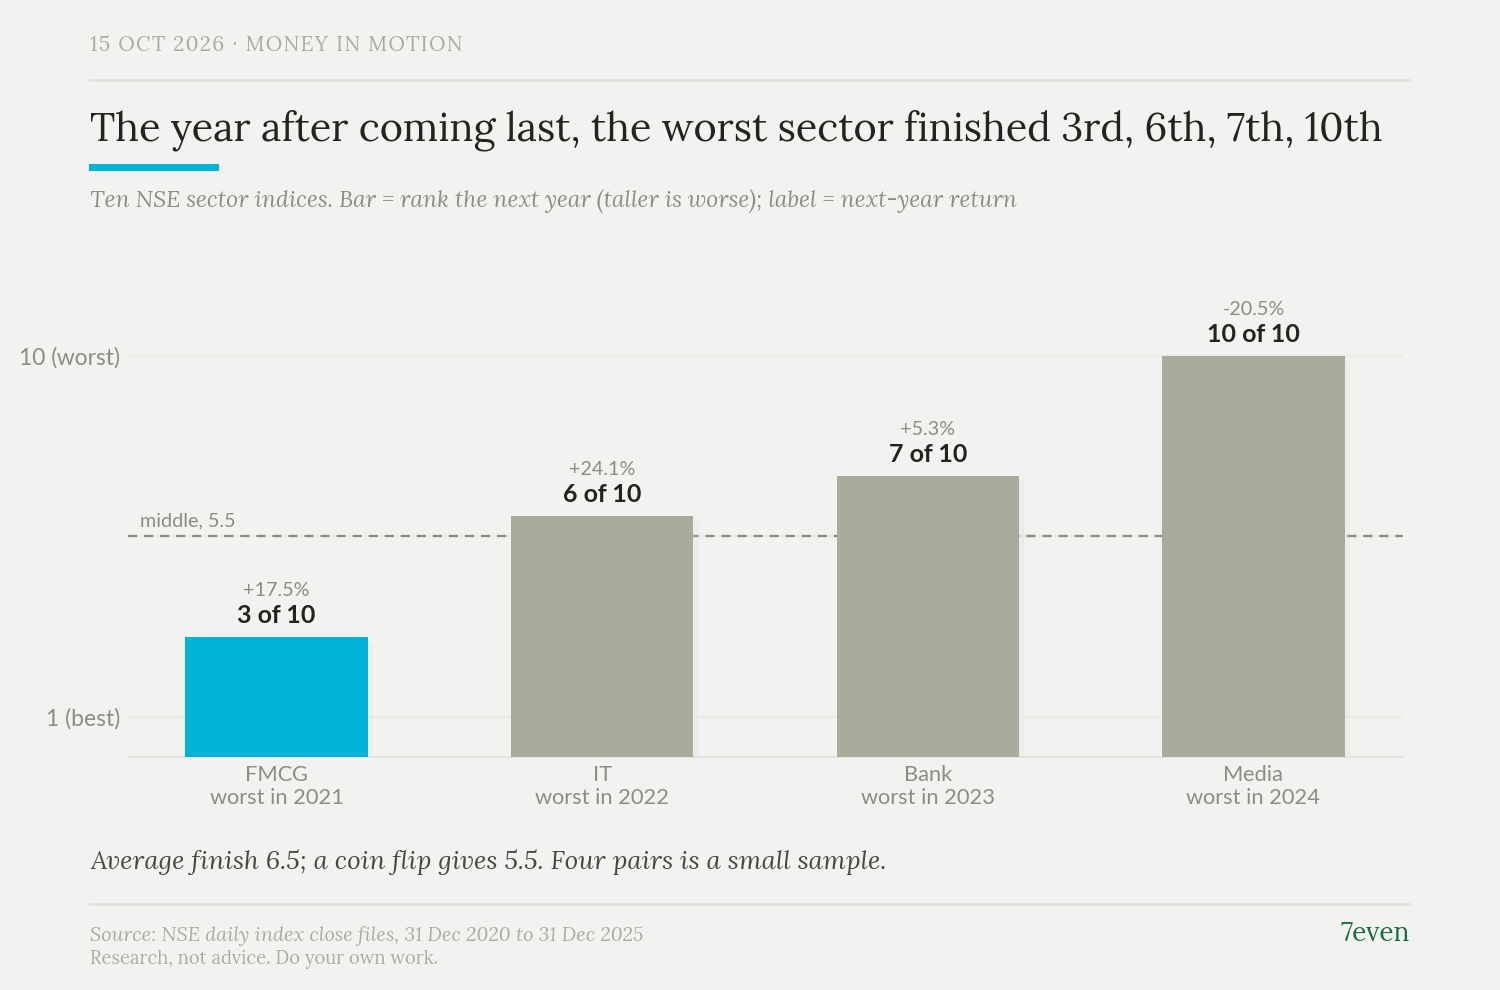
We tested the idea that the worst sector of a year is due a bounce. We took ten NSE sector indices and, in each of the calendar years 2021 to 2024, found the sector with the lowest price return. Then we looked at where the same sector finished the next year among the ten. It finished third, sixth, seventh and tenth. The average finish is 6.5, and a random draw of rank gives 5.5. The test is rank, not direction: "bounce" here means finishing in the top half of the ten, not simply rising.
Some setup. A sector index is NSE's index of the listed companies in one industry, and a calendar year here runs from the last NSE close of one year to the last close of the next. The ten indices are NIFTY Auto, Bank, Consumer Durables, Energy, FMCG, IT, Media, Metal, Pharma and Realty. We checked their current constituent lists and none shares a company with another, so no index in the set sits inside another. These are price indices: dividends are not included.
What happened to each year's worst
| Worst sector of | Its return that year | Its finish the next year | Its return the next year | |---|---|---|---| | 2021 | FMCG +9.96% | 3rd | +17.54% | | 2022 | IT -26.04% | 6th | +24.08% | | 2023 | Bank +12.34% | 7th | +5.32% | | 2024 | Media -23.88% | 10th | -20.53% |
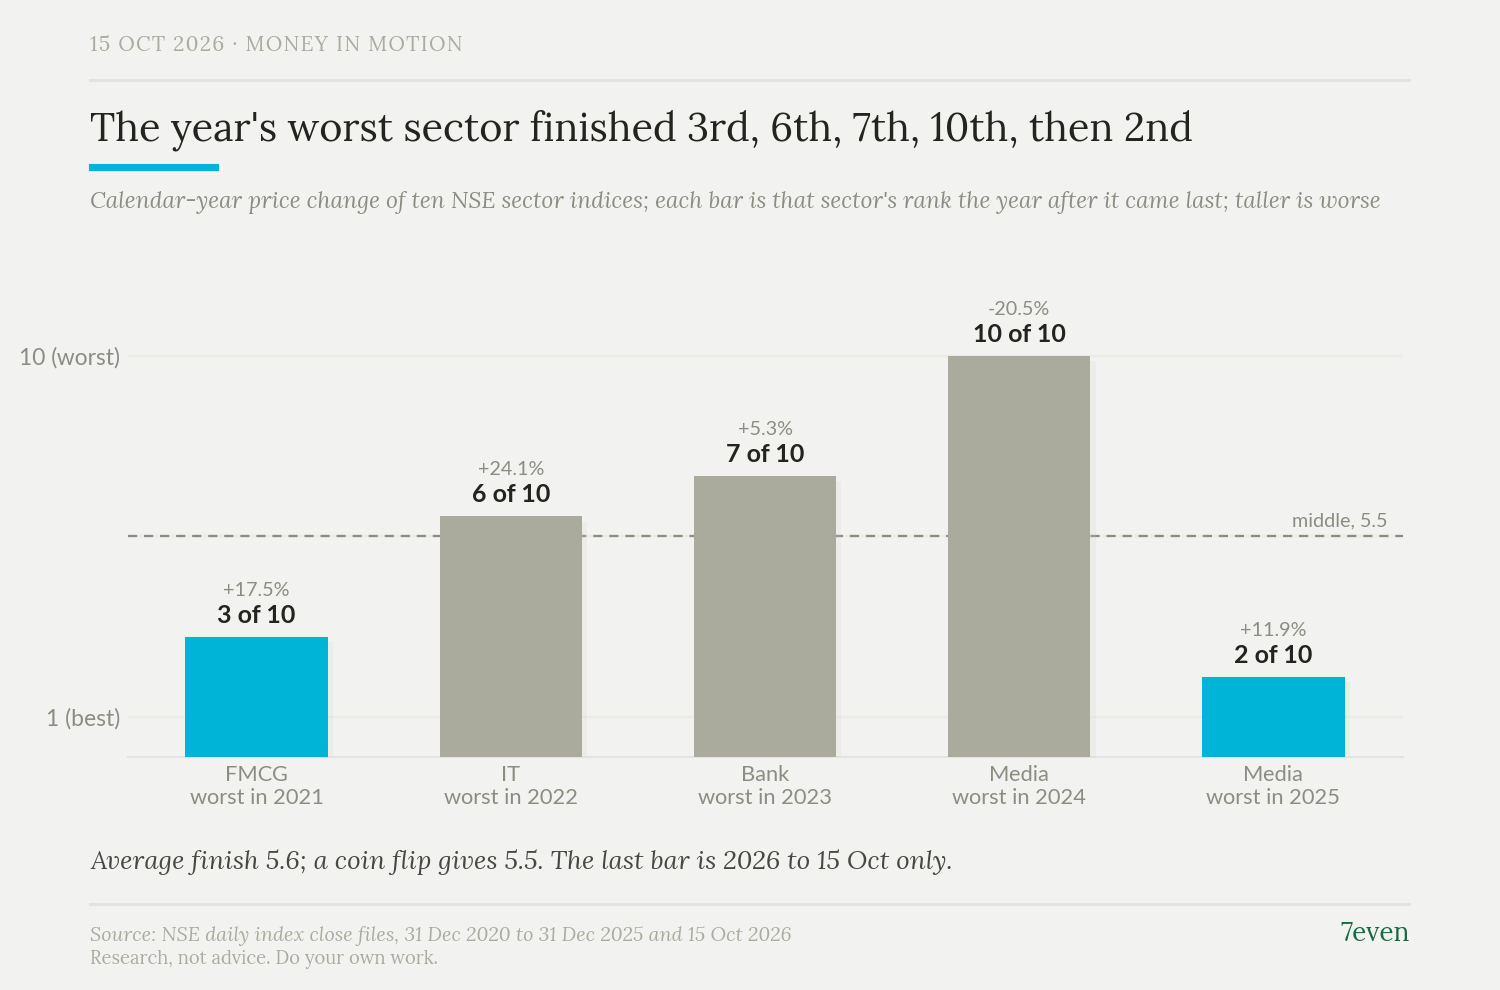
One of the four finished in the top three the next year, and one finished last again: NIFTY Media was the worst of the ten in 2024 and the worst again in 2025. In absolute terms three of the four rose the next year, but they finished 3rd, 6th and 7th among the ten, and the fourth fell and came last.
The fifth pair, 2025's worst against 2026, is left out of the count because 2026 is not over.
Does a sector's rank carry into the next year?
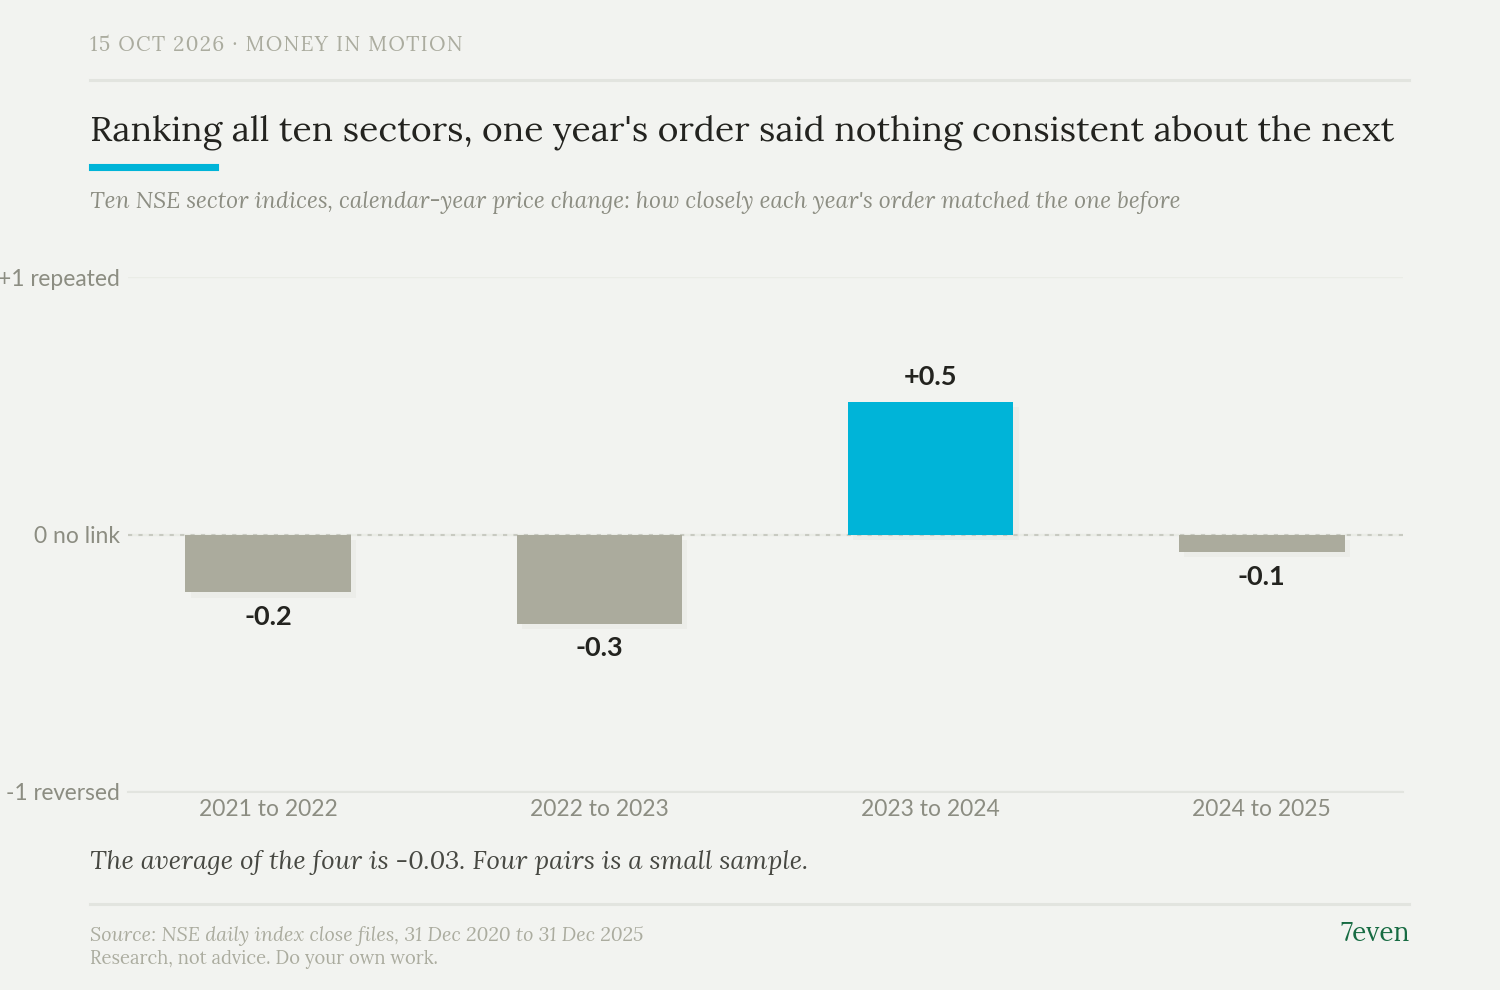
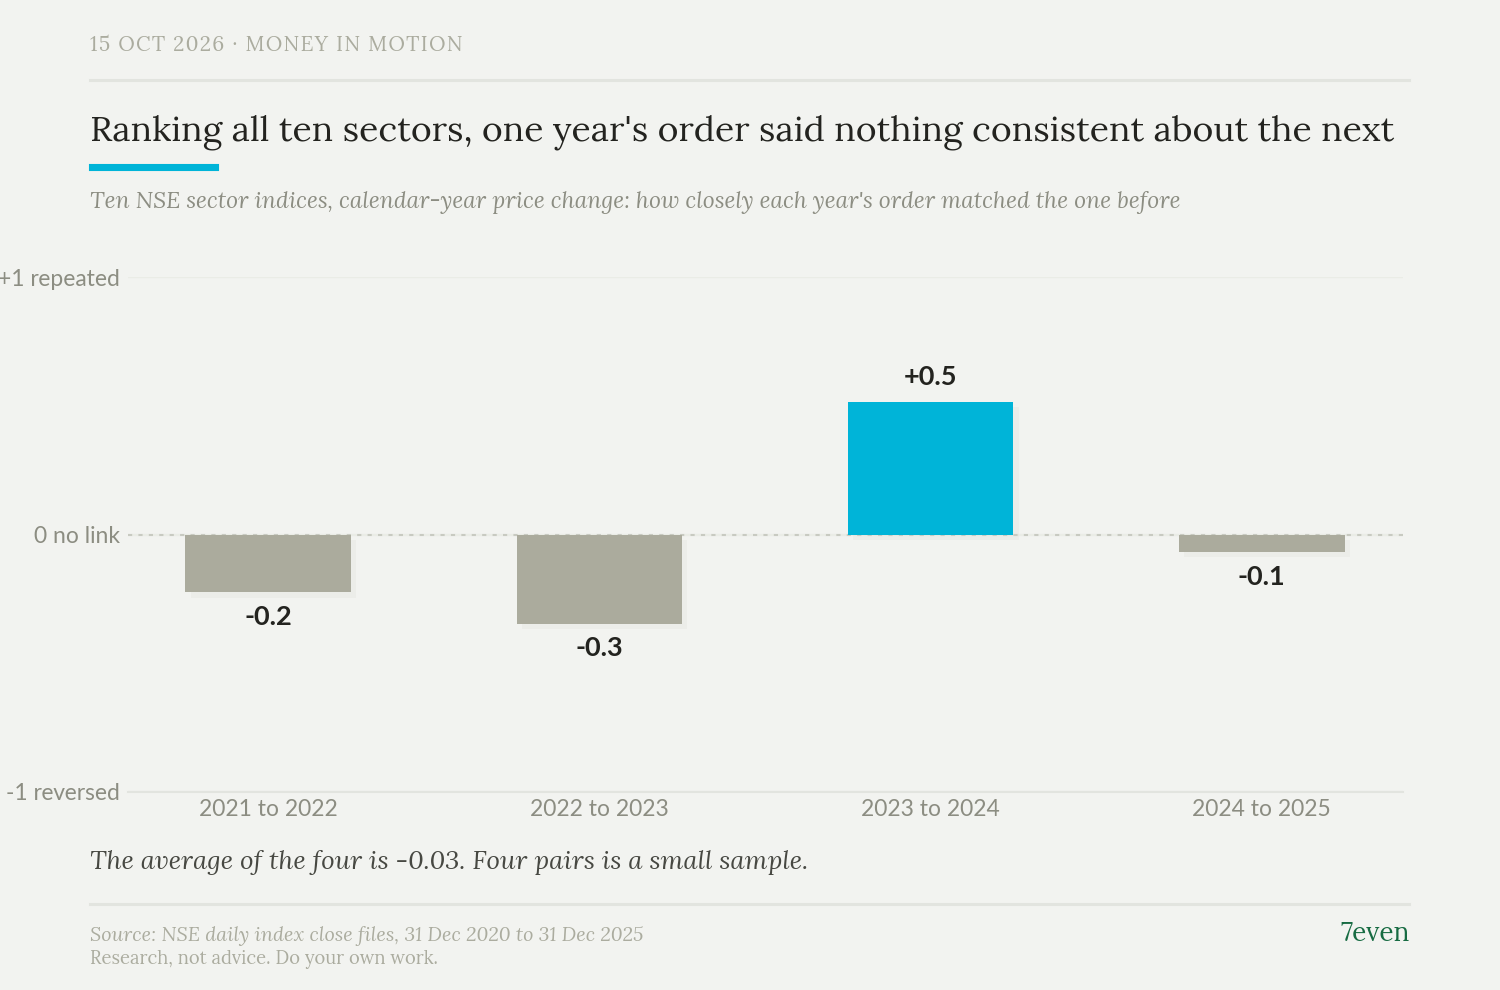
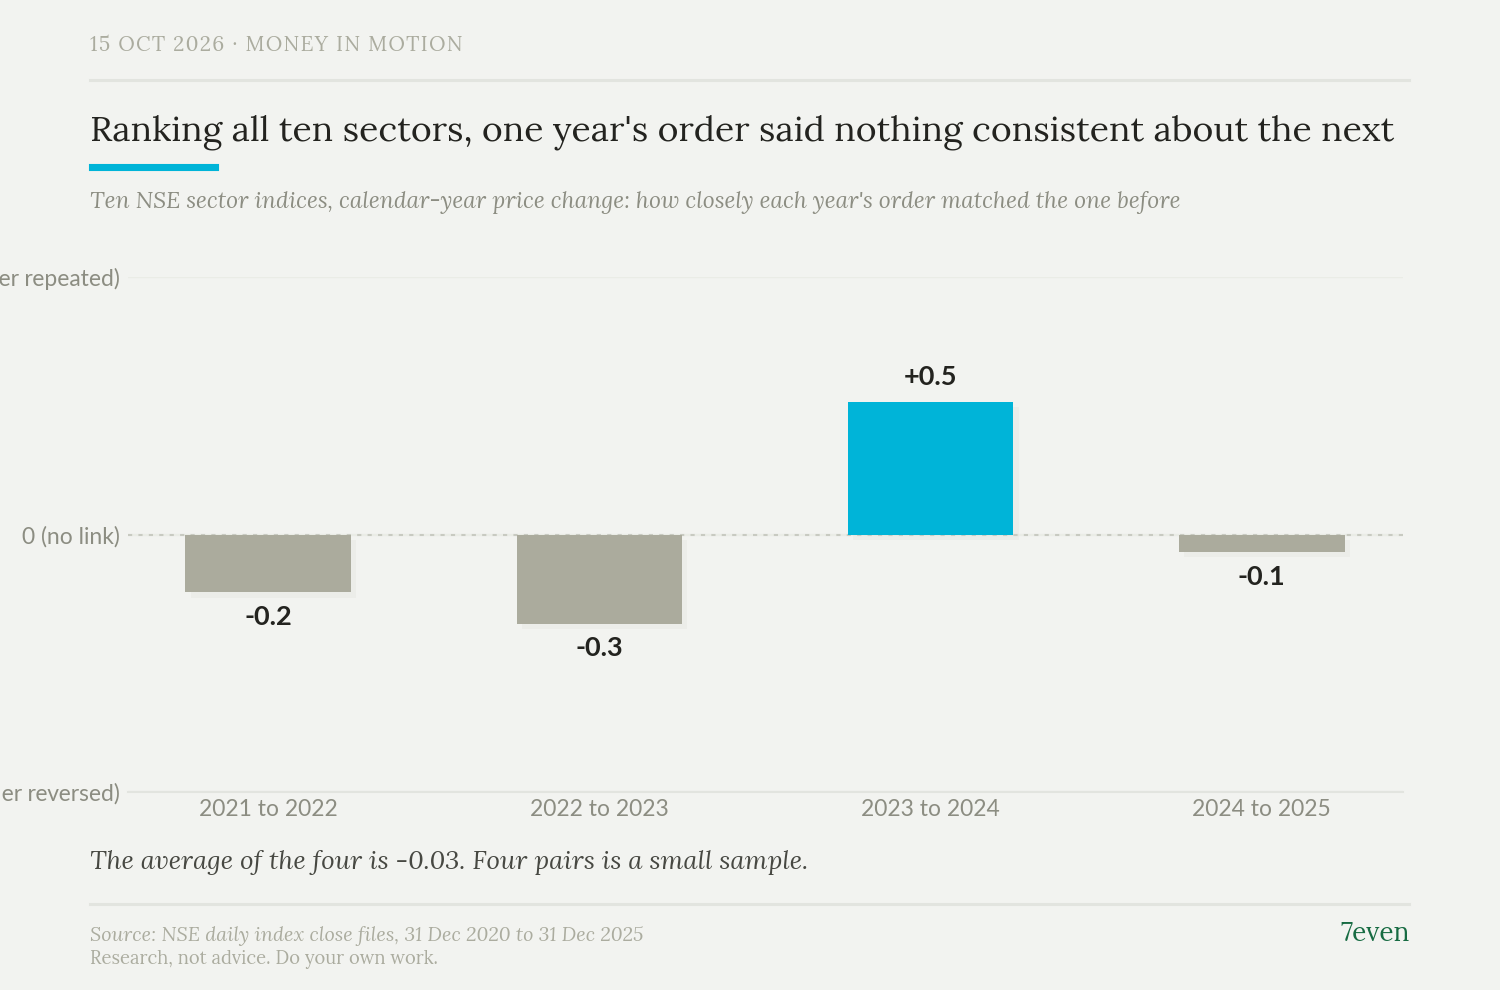
A cleaner test uses all ten sectors, not just the worst one. For each pair of consecutive years we compared the ranking of all ten with a rank correlation: +1 means the order repeated exactly, -1 means it reversed, and 0 means no relationship. The four pairs came out at -0.2, -0.3, +0.5 and -0.1, and their average is -0.03. In these four pairs the order did not repeat or reverse in any consistent way.
We also repeated the worst-sector test on a wider set of fifteen sector indices, adding Financial Services, Private Bank, PSU Bank, Oil & Gas and Healthcare. The worst sector in 2021 is then Private Bank, not FMCG, and the next-year finishes are 3rd, 8th, 11th and 15th of fifteen. Those fifteen overlap, because Energy and Oil & Gas share 13 companies and Pharma and Healthcare share 16 on current lists, so this is a robustness check and not fifteen independent sectors.
What we cannot say
This could be wrong in several ways, and the first is size. Four pairs is a very small sample. One good finish and three weak ones is what a run of luck can look like too. We are not saying a worst sector never bounces, only that these four did not do so reliably.
The 2021 pick is close. FMCG's +9.96% beat Pharma's +10.12% to last place by 0.16 of a percentage point. Had Pharma been the worst of 2021, it finished 8th in 2022, and the average finish would be 7.8.
We have not split any of these moves by company. The ranks are those of the published indices, and none of these index moves has been split by company.
Closing prices show what moved, not why. Nothing here says what drives a sector's year, and rank in one year is only one thing that could be tested against the next.
So how many years of worst-sector finishes would it take to tell luck from a pattern?
Research, not advice. Do your own work.