On 5 Oct 2026, only 20.6% of NIFTY 500 stocks, about one in five, closed above their own 50-day average (EMA). On 1 Oct it was 17.3%. Since 2016, only 251 of 2,654 trading days have looked this weak. On a normal day the figure is 56.7%.
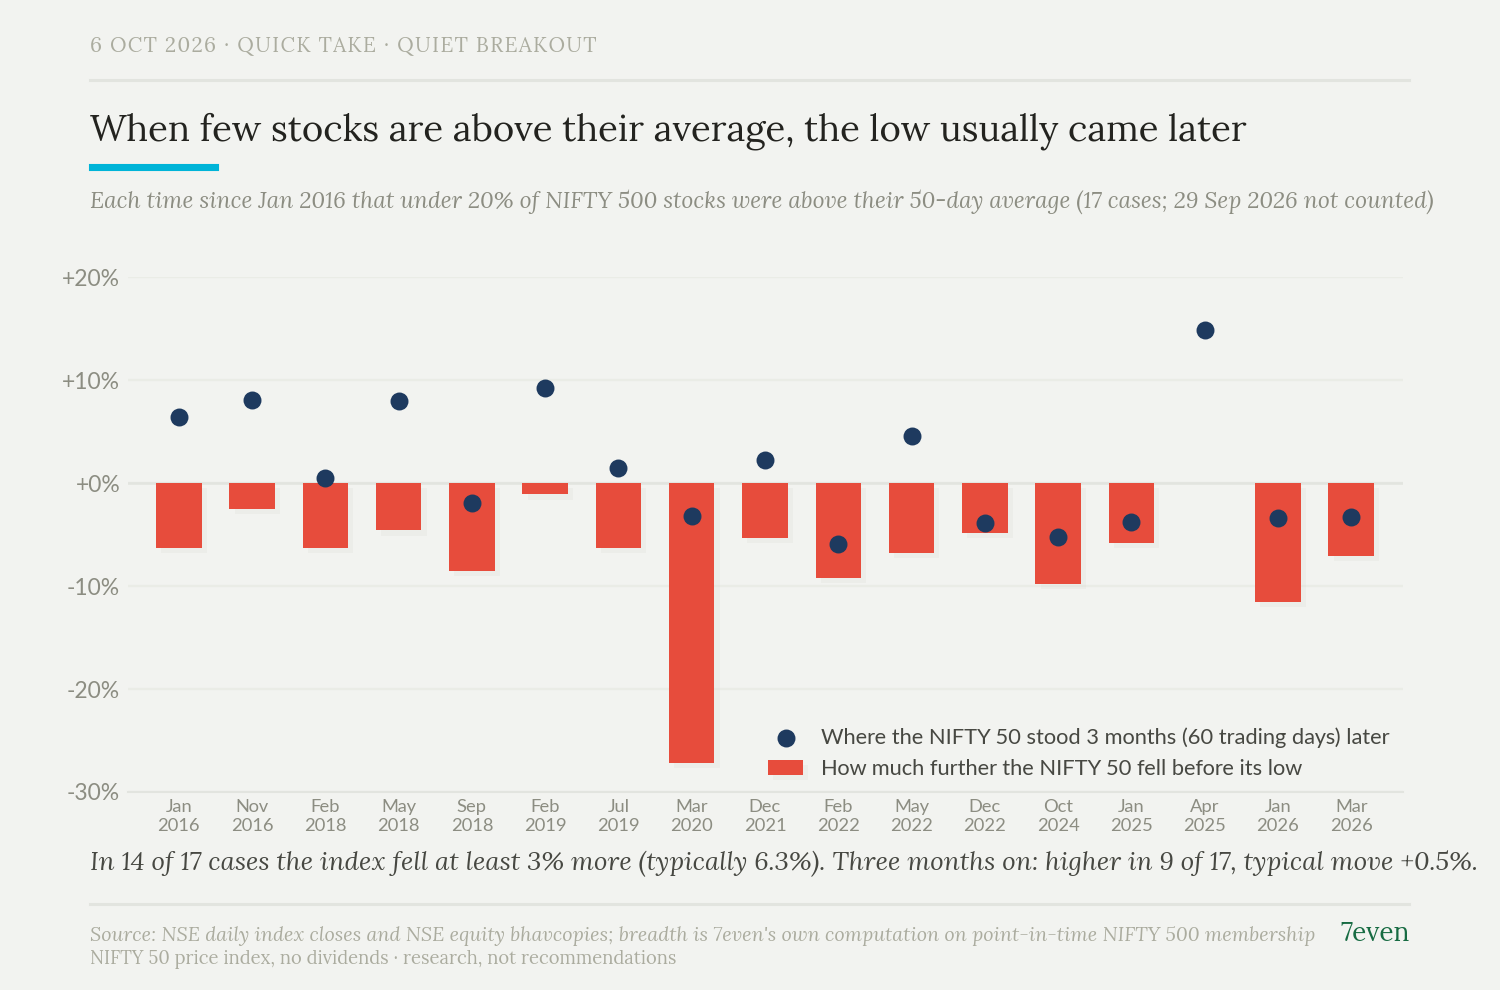
People often say this is when markets bottom. We checked. Breadth has fallen this low 17 times before since 2016. In 14 of those 17 cases the NIFTY 50 kept falling for a while, typically another 6.3%, and the low came about 32 trading days later. About three months (60 trading days) after breadth hit 20%, the NIFTY 50 was higher in only 9 of 17 cases. The typical move was +0.5%, close to flat.
The bounce did come, but from the eventual low, not from the day breadth hit 20%. From those lows, the NIFTY 50 typically rose 11.5% over the next three months.
So a weak breadth reading says the market is in a bad patch. It does not say the bottom is in. Seventeen cases is a small sample, and the NIFTY 50 price index leaves out dividends. Breadth fell to 20% again on 29 Sep. Our full study on what breadth can and cannot tell you is coming.
Research, not advice. Do your own work.