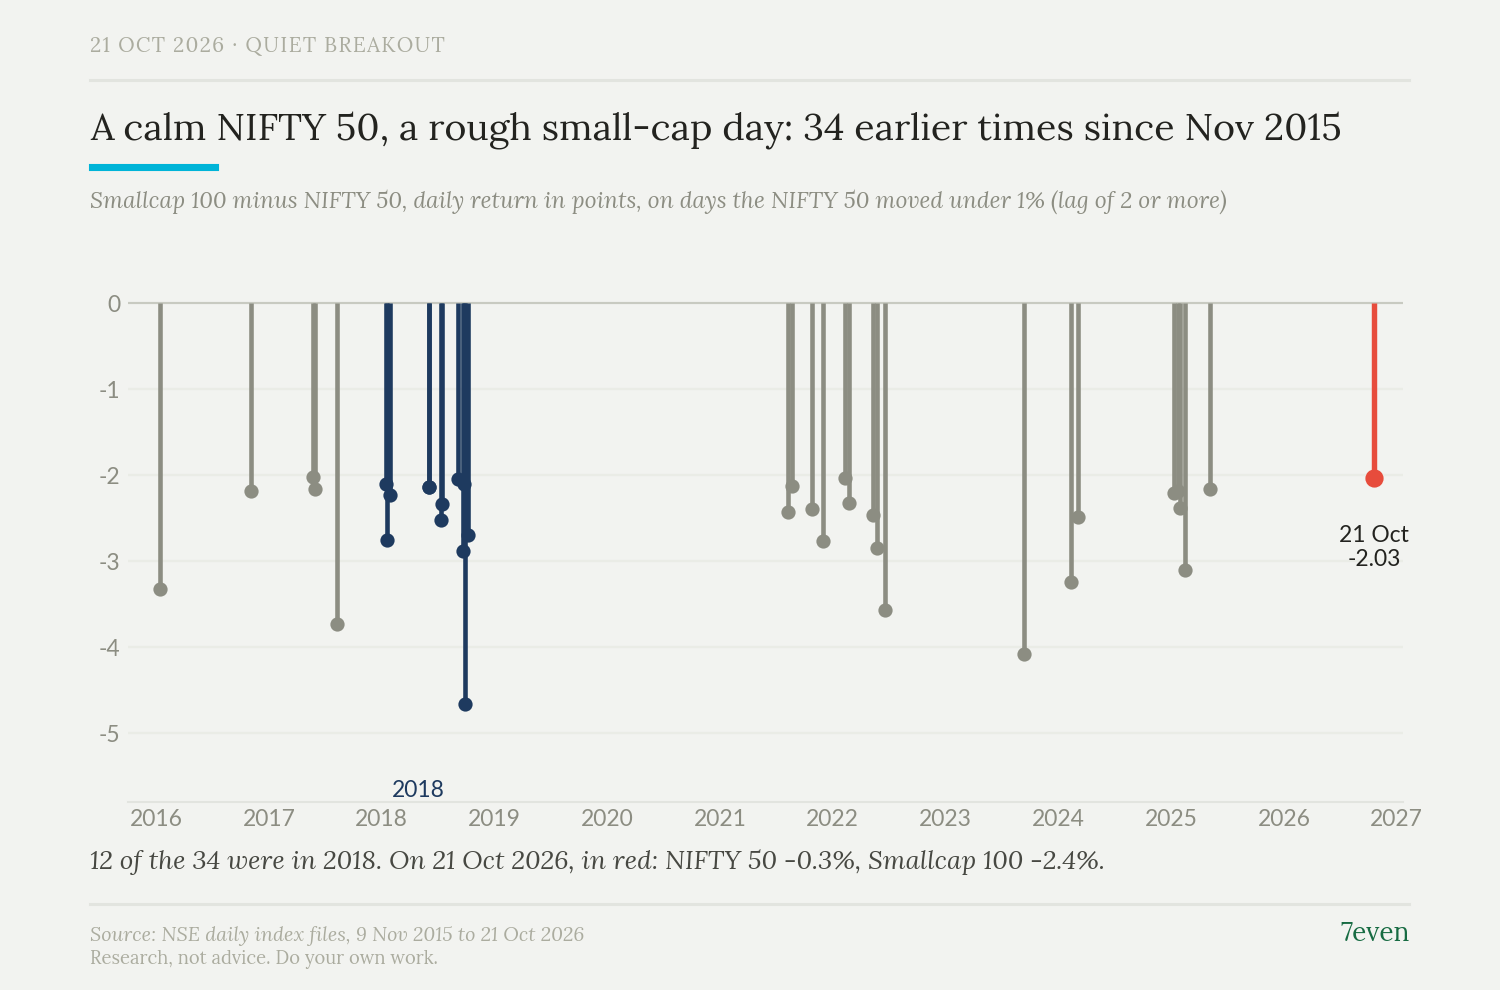
On 21 Oct 2026 the NIFTY 50 fell 0.3% while the Nifty Smallcap 100 fell 2.4%. A calm index, a rough small-cap day: since 9 Nov 2015 it has happened 34 times before, about once every four months on average (the NIFTY 50 moved under 1%, small caps lagged by 2 points or more).
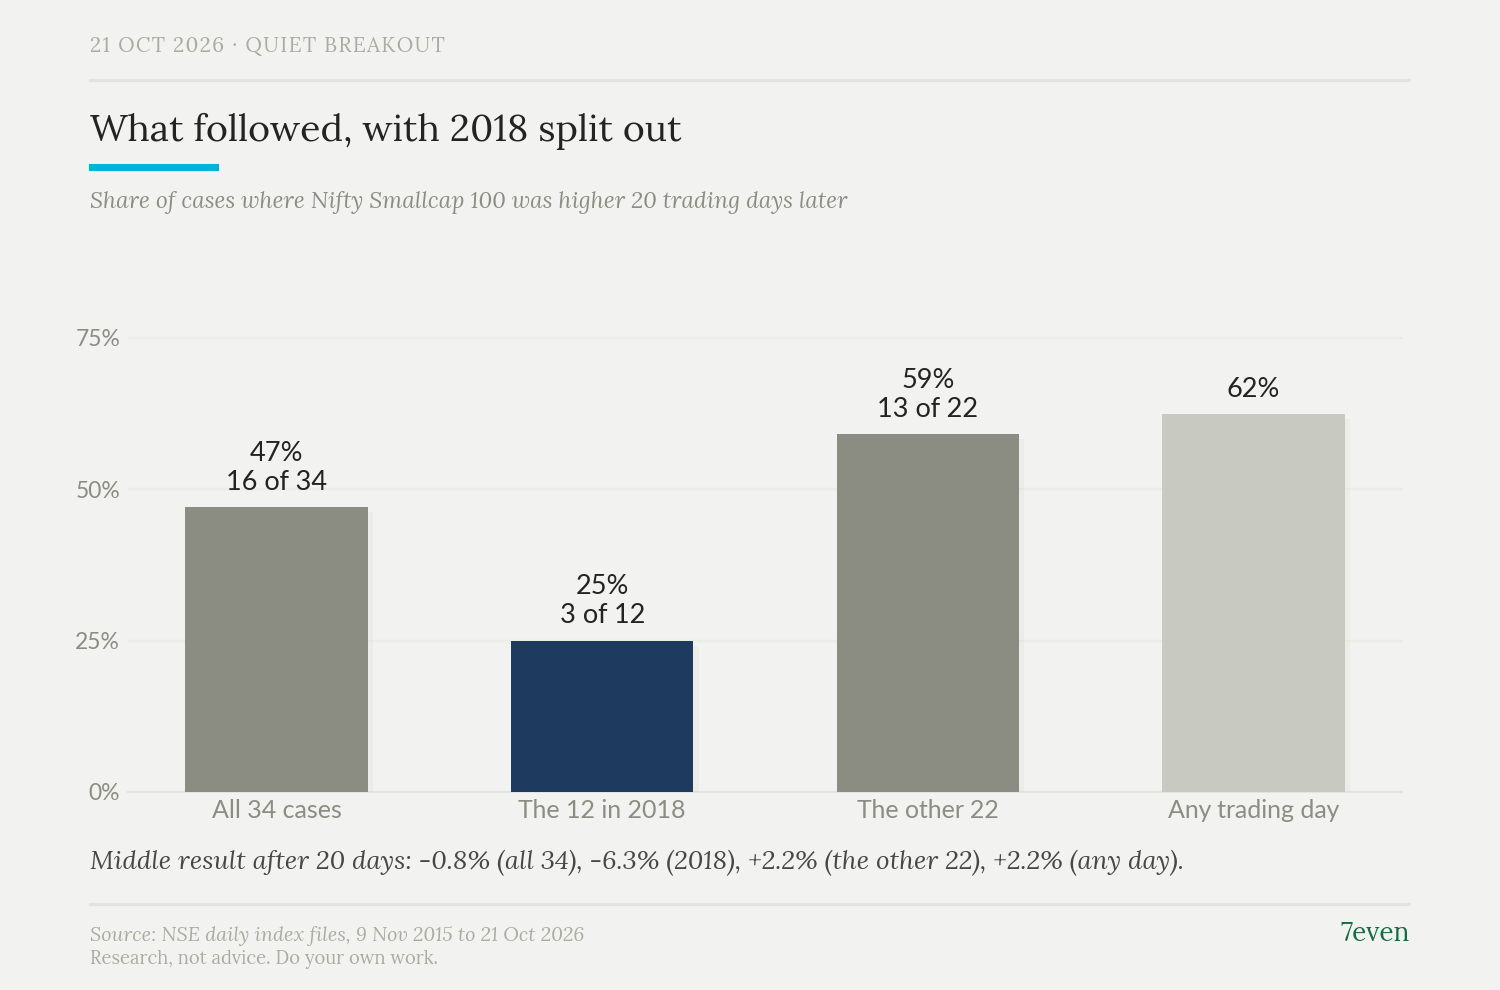
At first it looks worrying. 20 trading days later, the Smallcap 100 was higher in 16 of the 34 cases (47%), against 62% of all trading days. But 12 of the 34 fell in 2018, and there it was higher in only 3 of 12, with a middle result of -6.3%. In the other 22 cases it was higher in 13, with a middle result of +2.2%, the same as any day.
These cases do not show a clear signal. How this could be wrong: the sample is small, the cases overlap, we split out 2018 after seeing the first result, and these are price indices. What made 2018 different?
Research, not advice. Do your own work.