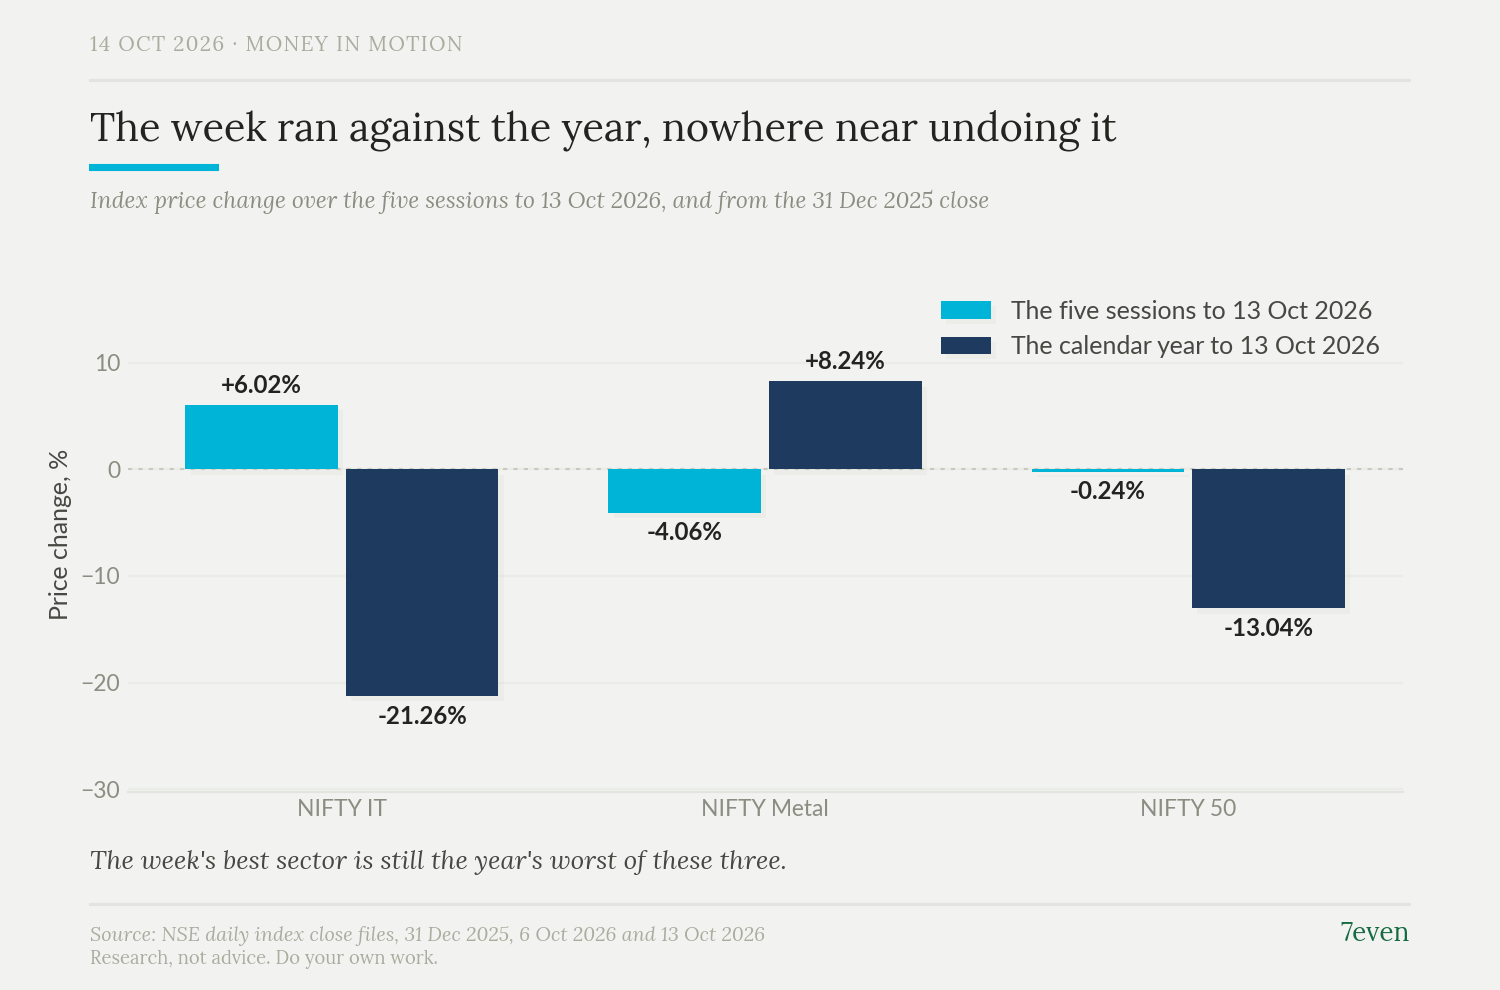
Over the five trading sessions from the 6 October close to the 13 October close, NIFTY IT rose 6.02%, and eight of the ten companies in it had not published a September-quarter number. The NIFTY 50 fell 0.24% over the same five sessions.
Some setup. The NIFTY 50 is NSE's index of 50 large and heavily traded listed companies. Mid-sized companies, the NIFTY Midcap 150, fell 0.68% over the same five sessions, and smaller ones, the NIFTY Smallcap 250, fell 0.38%. NSE's daily index file carries closes for 166 NIFTY indices, sector indices among them but also bond and strategy ones, and of those 166 NIFTY IT's 6.02% is the biggest gain. The next biggest was 4.13%. At the other end NIFTY Metal fell 4.06%, the biggest fall of the 166. So the distance between the week's best index and its worst was 10.08 percentage points, which is just the difference between the two percentage changes.
It is not one company's week
The IT index holds ten companies. Take each one's move, weight it by how big a share of the index that company is, and the ten add up to 6.02 percentage points, which is the published index move. All ten rose, by between 1.51% and 10.10%, and the largest single contributor is 25.5% of the move. The metal index works the same way in reverse: 14 of its 15 companies fell, and its largest single contributor is 22.2% of the move. Neither index is one company's week wearing a sector's clothes.
Two sets of results, and two sessions
NSE publishes a calendar of the board meetings at which listed companies approve their quarterly results. Two of the ten IT companies held that meeting inside the five sessions, on 8 October and on 12 October. Those two are 30.89% of the index. The other eight, the remaining 69.11%, had held no such meeting by the 13 October close. Six of the eight have one dated between 15 October and 23 October.
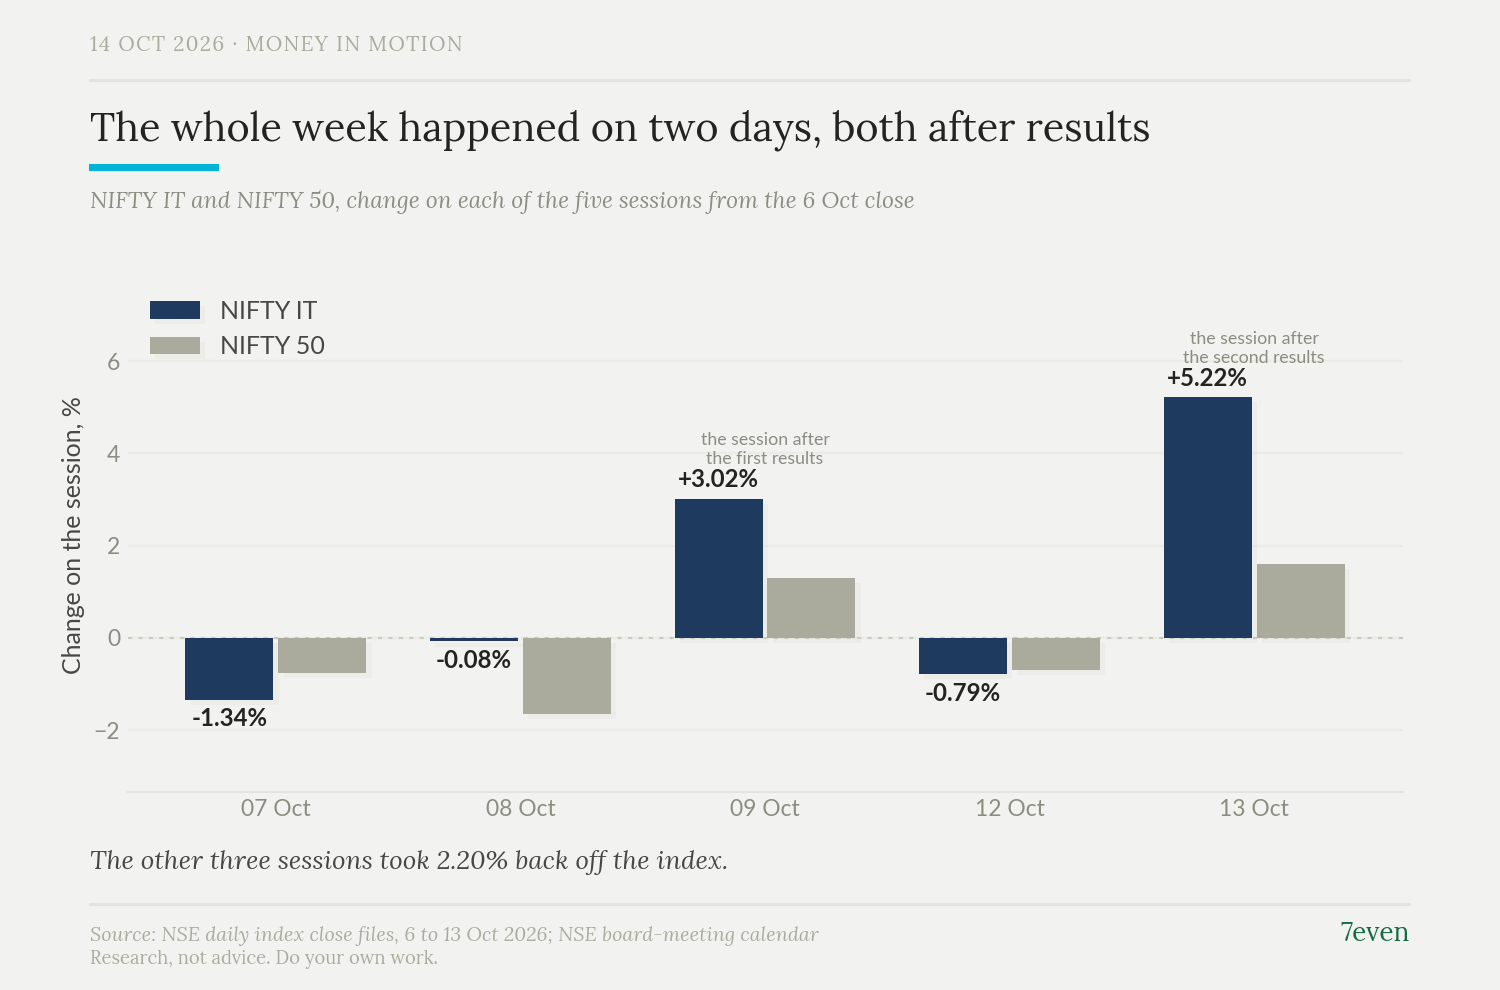
The whole of the week's gain sits in two sessions. The index rose 3.02% on 9 October, the session after the first of those two board meetings, and 5.22% on 13 October, the session after the second. Those two sessions together are worth 8.40%, and the other three took 2.20% back off. Both of those two were up days for the whole market, so part of each one is market rather than sector: NIFTY IT beat the NIFTY 50 by 1.72 percentage points on 9 October and by 3.62 on 13 October.
What it was not
No company in either index went ex-dividend, ex-bonus or ex-anything else between 7 and 13 October, so the closing prices above need no adjustment for a corporate action. The IT index did not change its ten companies inside the window either. A fixed set of ten names on 30 September weights rebuilds the published index move to within 0.0009 of a percentage point, which it could not do across a change of constituents.
What we cannot say
We cannot say from index closes why the other eight rose. Closing prices show what moved and when. That does not prove why, and they do not separate a sector being read again after two sets of results from a sector moving on something that reaches all ten companies at once, or either of those from a group that had already fallen a long way.
It had. This index came into the week down 26.87% for the calendar year to the 30 September close, and even after the biggest gain of the 166 it is down 21.26% for the calendar year to the 13 October close, against the NIFTY 50's 13.04% fall. NIFTY Metal, the biggest fall of the 166 in the same five sessions, is up 8.24% for that calendar year. One week has not changed the year.
The next thing that can speak to any of this is the eight board meetings themselves, six of them dated between 15 October and 23 October. Until those numbers are out, what happened is clear and why it happened is not.
So what moved the eight?
Research, not advice. Do your own work.