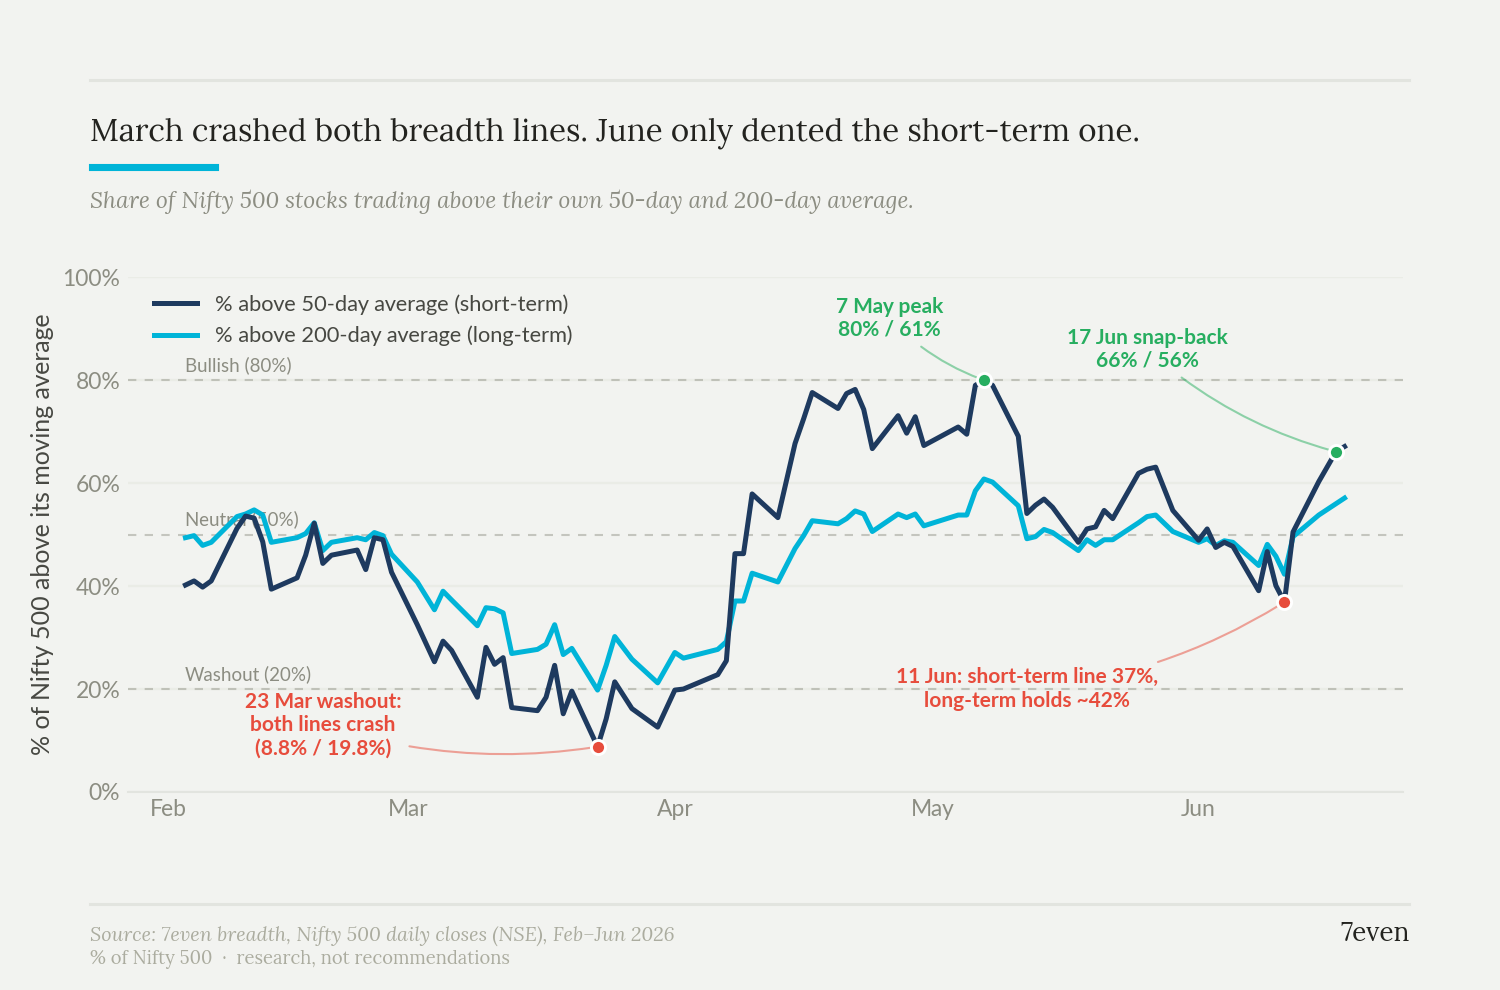
A month ago, 4 in 5 Nifty 500 stocks were trading above their 50-day average.
By 11 June, fewer than 2 in 5 were.
On the index it looked like another scare. But the longer-term gauge, the share of stocks above their 200-day average, barely moved. It stayed nowhere near its March low.
That split is the tell. When both the short-term and long-term gauges collapse together, it's a real breakdown. When only the short-term one drops, it's a shakeout inside a trend that's still standing.
June was the second kind, and breadth is already climbing back. We're watching whether the long-term gauge holds above 50%.