Autos and auto components account for 6.65% of NIFTY 50. Financial services account for 37.45%. That difference matters when September sales are turned into a view on the whole index. These are the weights in the NSE Indices factsheet dated 30 September.
The releases published on 1 October show different stories within autos. A domestic motorcycle slowdown, a tractor comparison affected by festival timing, and growing passenger-vehicle volumes should not be collapsed into one demand signal.
The sales picture is uneven
Each row below keeps its own company's reporting scope. These are company-reported sales, not a common retail-registration dataset. September year-on-year changes are calculated from the filings, except Hyundai's reported percentage.
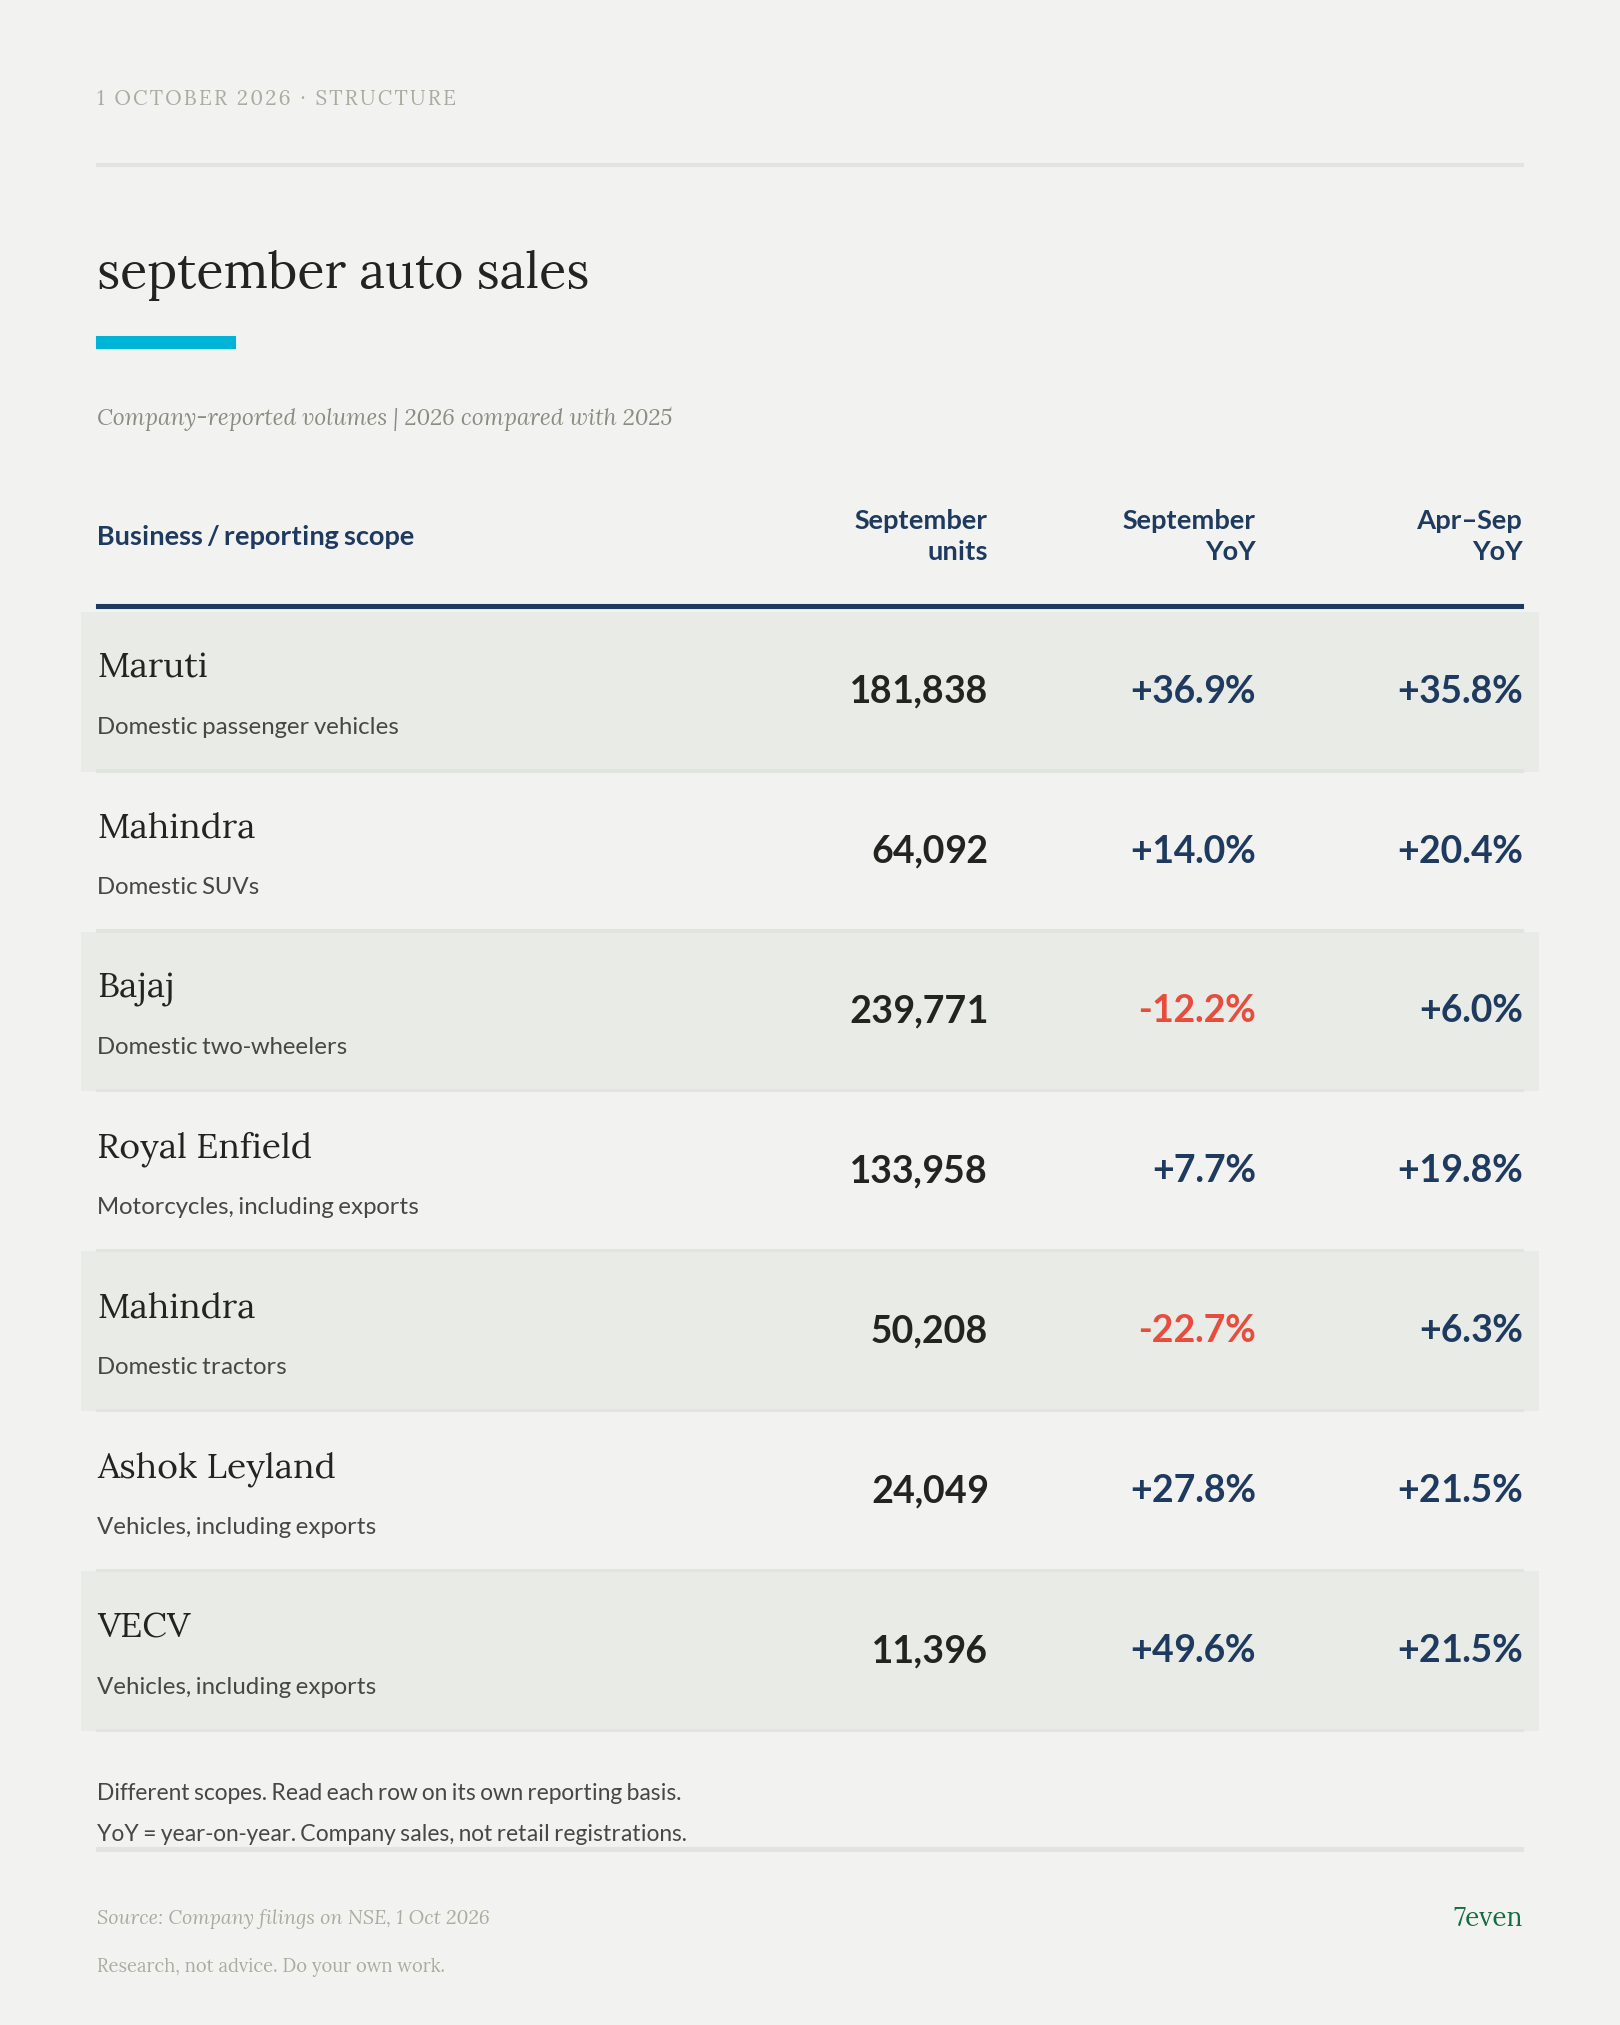
Hyundai's domestic sales increased 10.9% to 57,166 units. That is another positive passenger-vehicle reading, although Hyundai is outside NIFTY 50.
Slower growth can coexist with higher monthly volumes
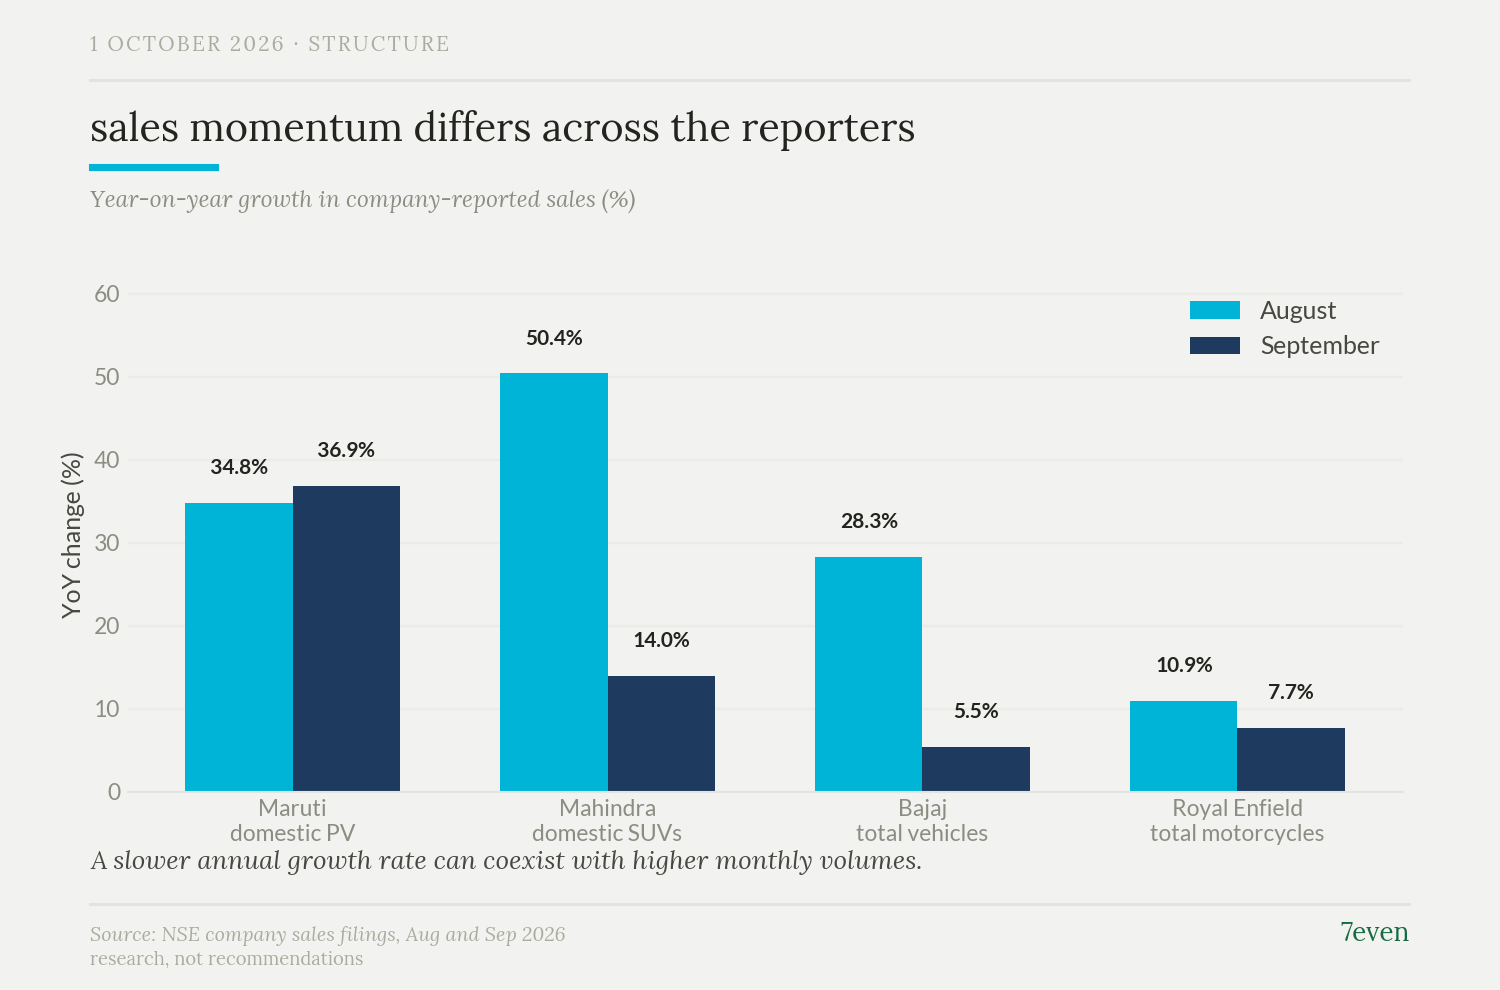
Bajaj's total sales growth slowed from 28.3% in August to 5.5% in September. September domestic two-wheelers declined 12.2% against last year, but rose 18.8% from August. Exports across the company grew 31.7% year-on-year, while falling 12.9% month-on-month. Both comparisons matter: the slowdown is real against last year's volumes, while domestic dispatches increased sequentially.
Mahindra's domestic SUV growth slowed from 50.4% to 14.0% year-on-year. Yet September SUV volumes rose 8.2% from August. Maruti's domestic passenger-vehicle volumes rose 2.8% sequentially, with YoY growth increasing from 34.8% to 36.9%. The passenger-vehicle evidence does not show a uniform decline.
The tractor base explains part of the comparison
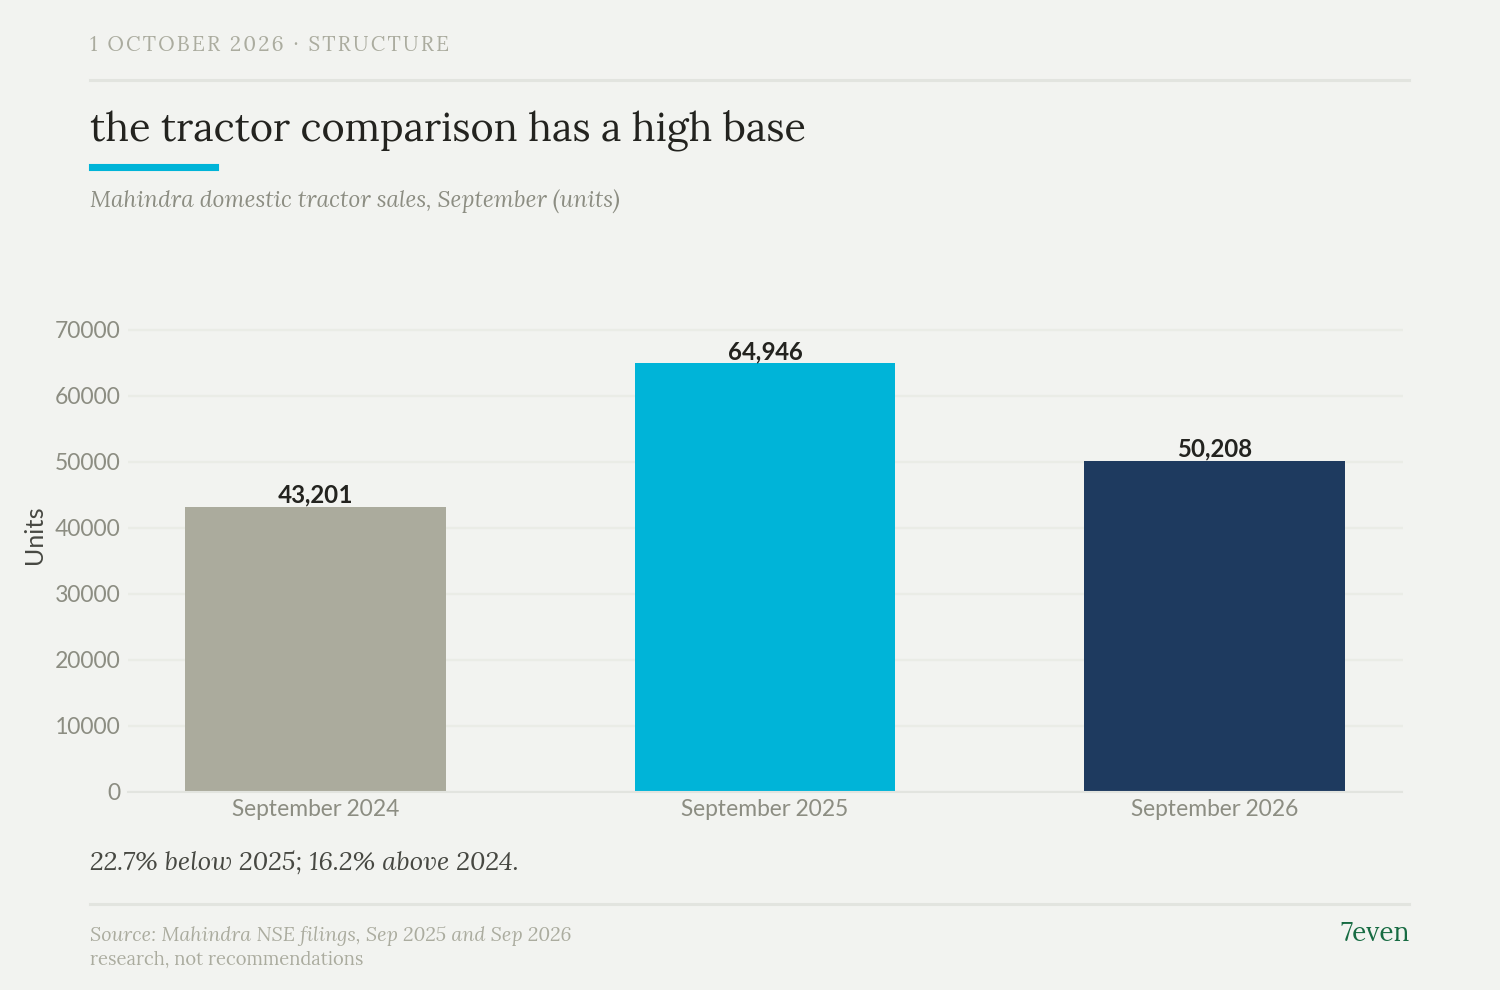
Mahindra sold 43,201 domestic tractors in September 2024, 64,946 in September 2025 and 50,208 in September 2026. The latest month is 22.7% below last year and 16.2% above two years earlier.
Mahindra attributes the decline to the festive season shifting into October and the higher GST-supported base last September. Its domestic tractor sales still grew 6.3% over April–September. However, Escorts also cites patchy monsoon conditions and relatively lower Kharif sowing alongside the calendar and base effects. Its July–September total tractor sales grew only 0.4%. The comparison base is an explanation to test, not proof that underlying demand is unaffected.
Translate sales into index exposure before making a weekly call
NIFTY Auto contains 15 companies. Only five also appear in NIFTY 50: Mahindra, Maruti, Bajaj Auto, Eicher Motors and Tata Motors Passenger Vehicles. Hyundai, TVS, Hero and Ashok Leyland are outside that benchmark. An auto-industry headline and NIFTY's auto exposure therefore cover different sets of companies.
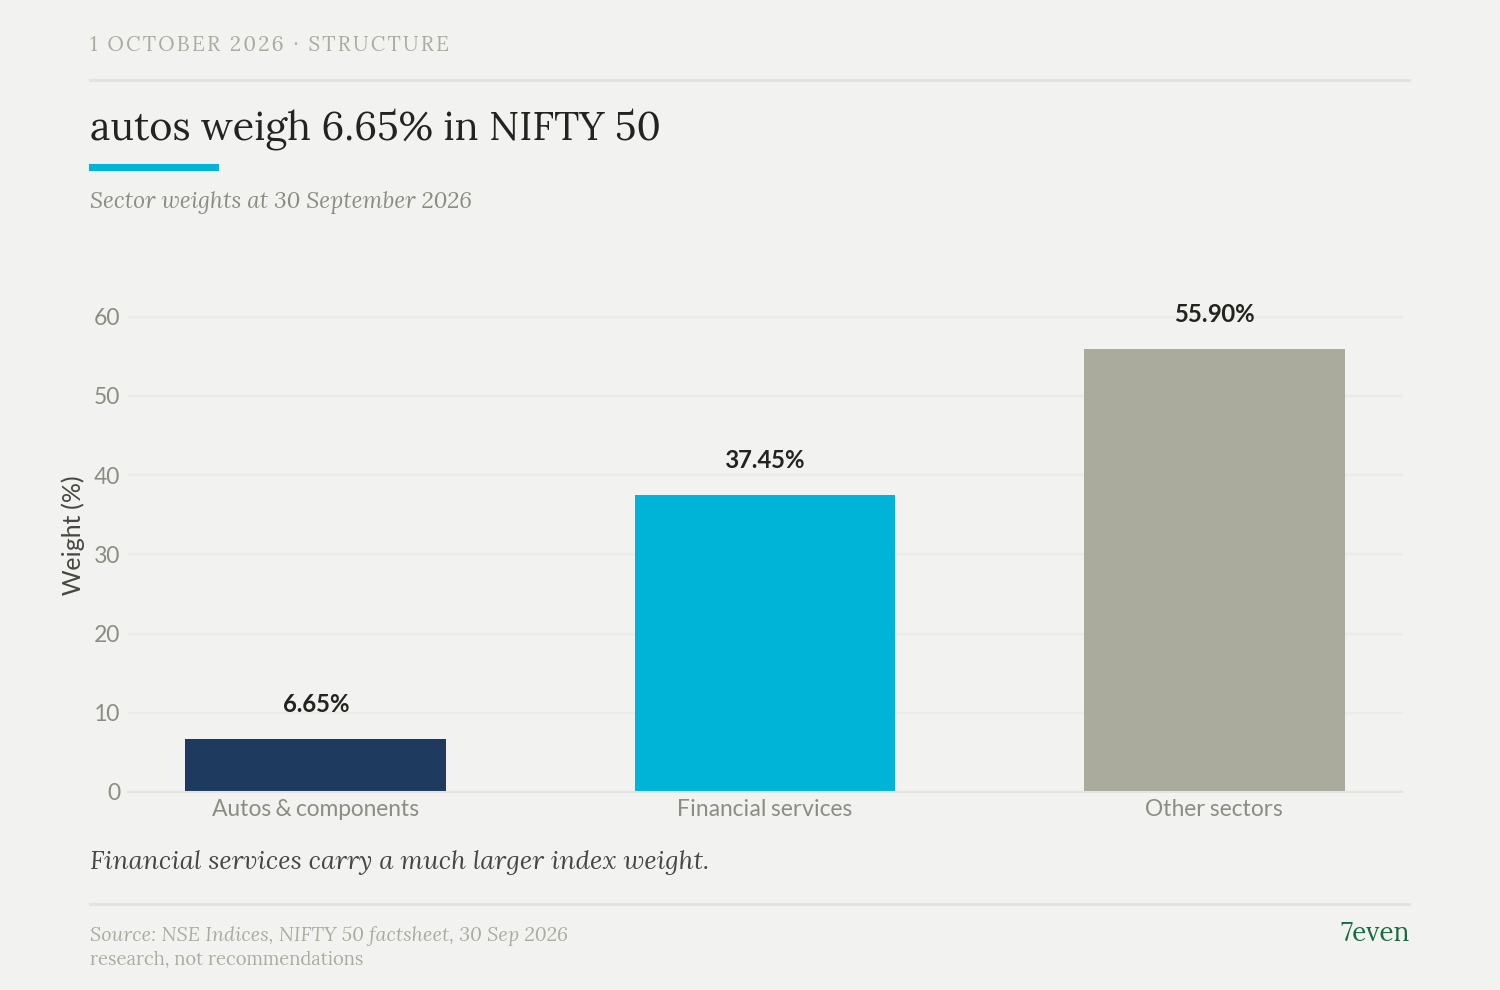
Our illustrative sensitivity, not a forecast: if NIFTY 50's auto holdings collectively fell 3%, their 6.65% starting weight would subtract approximately 0.20 percentage points from the index, with every other holding unchanged. This does not assume that a 3% move in NIFTY Auto transfers to those five holdings.
At the same fixed weights, a 0.53% rise in NIFTY 50's financial-services holdings would approximately offset that direct drag. This refers to the holdings within NIFTY 50, not the separate NIFTY Financial Services index. The calculation is sector weight multiplied by the assumed return.
There is also a calendar constraint. NSE's capital market is closed on 2 October. The releases arrive in the final scheduled session of the week beginning 28 September; the next scheduled session is 5 October.
What could change this reading?
The sensitivity isolates direct index arithmetic. If weakness spreads into other holdings, total index losses can exceed the auto contribution. Conversely, gains elsewhere can offset it. Both are conditional outcomes, not predictions.
The sales interpretation also needs another test: whether the coming festive period validates management's calendar explanation. If tractor weakness persists across the festive comparison, or company-reported sales growth weakens more broadly, September's mixed picture would need revisiting.
How much of the next index move comes from its auto holdings, and how much comes from the rest of NIFTY? The sales releases alone cannot settle that question.
Sources
- Maruti domestic passenger vehicles: August 2026, September 2026.
- Mahindra SUVs and tractors: August 2026, September 2026.
- Mahindra tractor comparison: September 2025.
- Bajaj sales: August 2026, September 2026.
- Royal Enfield sales: August 2026, September 2026.
- Hyundai sales: September 2026.
- Ashok Leyland sales: September 2026.
- VECV sales: September 2026.
- Escorts tractor sales: September 2026.
- NIFTY 50 weights and methodology: 30 September 2026.
- NIFTY 50 constituents: Official list.
- NIFTY Auto constituents: Official list.
- NSE capital-market holiday calendar: 2026 circular.
7even publishes research, not recommendations. Nothing here is investment advice. Always do your own work, and consult a SEBI-registered advisor before acting on anything you read.